Automatic dependent surveillance – broadcast (ADS–B) is a cooperative surveillance technology in which an aircraft determines its position via satellite navigation and periodically broadcasts it, enabling it to be tracked. The transponder transmission has the following properties:
The tuning frequency and bandwidth are well within the capabilities of the AD9361 RF transceiver, and the received IQ samples can be detected and decoded with a variety of software or embedded platform options.
In this section, we will show an airplane tracking example, where the ADS-B signal is captured by FMCOMMS3 and then streamed from target to Simulink or MATLAB via the libiio interface. Consequently, the captured signal is demodulate by the receiver algorithm based upon an existing MATLAB example Tracking Airplanes Using RTL-SDR Radio with MATLAB, and all the airplane information is displayed in a table.
This example comes in both MATLAB and Simulink. In order to run the MATLAB version of this example, your MATLAB version should be 2014b or higher, and your license needs to include the following components:
In order to run the Simulink version of this example, your license needs to include the following component:
Besides, the following items are required:
The MATLAB example can be found here:
In this MATLAB example, we combine the data capture process and receiver algorithm, so you only need to run one script:ad9361_ModeS.m.
This function mainly consists of three parts:
Detailed comments have been provided in the function to describe the purpose of each part.
Depending on how you set up the Tx and Rx LO frequency, there are two ways of using this model: using pre-captured data and using live data.
In this case, we are transmitting and receiving some pre-captured ADS-B signals using FMCOMMS3. These signals are saved in a variable called “newModeS”. The requirement for this case is to make TX_LO_FREQ = RX_LO_FREQ, and it can be any LO frequency value that FMCOMMS3 supports.
The AD9361 attribute setting of this example is intended to work with real-world signal (gain mode = fast attack). Sometimes the pre-captured data is much higher in amplitude that the real-world signal. In this case, on the IIO Oscilloscope application, “Tx Attenuation” should be set to maximum so that the received signal matches real-world signals.
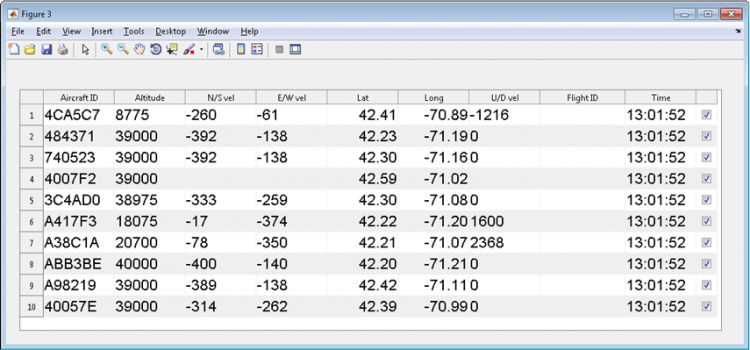
For each data frame being transmitted and received, you will get a result table as shown below.
Due to the nature of pre-captured data, there is plenty of information there, so it is a good way to verify whether your setup is appropriate.

In this case, we are receiving the real-world ADS-B signals over the air, instead of the signals transmitted by FMCOMMS3. According to ADS-B specification, it is transmitted at the center frequency of 1090 MHz, so the requirements for this case is:
Besides, if you are in a location with sparse aircraft traffic, it is recommended to run the model for longer time in order to capture some useful data. You can tell whether there is any useful data by looking at the spectrum analyzer. A typical ADS-B spectrum looks like this:
With everything set up properly, in order to run the MATLAB model, simply use the following command:
[rssi1,rssi2]=ad9361_ModeS('ip','data source',channel);
where ip is the IP address of your board, data source specifies the data source of your received signal. Currently, this example supports 'pre-captured' and 'live'. channel specifies whether you are receiving signals using Channel 1 or Channel 2 of FMCOMMS3.
For example, the following command receives the pre-captured date on Channel 2:
[rssi1,rssi2]=ad9361_ModeS('192.168.10.2','pre-captured',2);
At the end of the simulation, you will get the RSSI values on both channels, as well as the result tables shown in the previous case.
The following is an example result we got from the real-world ADS-B signal. Besides all the airplane information shown in previous case, we are also able to get the Flight ID as highlighted below.

This result table shows the information of aircrafts appearing during the simulation. With a proper antenna, this model is able to capture and decode the aircraft signals in an 80 miles range with FMCOMMS3. Since there are two types of Mode S messages (56 usec or 112 usec), some messages contain more information than the other.
The model using Simulink libiio can be found here:
This Simulink model is based upon an existing Simulink example provided by MathWorks:
The detector and decoding piece comes directly from that model, and we add the Simulink IIO System object to conduct the signal reception and hardware in the loop simulation.
The original model works with sample time = 1 and frame size = 1. However, the Simulink IIO System object works in a buffer mode - it accumulates a number of samples and then processes them. In order to make the original model works with the System object, we added two blocks between them: unbuffer to make frame size = 1 and rate transition to make sample time = 1. By doing this, we can keep the original model intact.
The Simulink model ModeS_Simulink_libiio.slx is shown in the figure below. We set up the target using iio_sys_obj block, and the received ADS-B signal is post processed by the detector and decoding subsystem.
Depending on how you set up the TX_LO_FREQ and RX_LO_FREQ, this Simulink model can be run in two modes: using pre-captured data “DataIn” and using live data. Taking the pre-captured data for example, at the end of the simulation, we can see the following results in command window:

Instead of the result table shown in the MATLAB model, the results here are displayed in the text format.
“Four Quick Steps to Production: Using Model-Based Design for Software-Defined Radio.”
If you have any questions about FMCOMMS3 / AD9361 or libiio system object, please ask on the EngineerZone. ADI Support
If you have any questions about ADS-B receiver algorithm, please contact MathWorks. MathWorks Support