


This version is outdated by a newer approved version. This version (04 Aug 2012 00:09) is a draft.
Approvals: 0/1The Previously approved version (24 Jul 2012 15:14) is available.
This version (04 Aug 2012 00:09) is a draft.Approvals: 0/1The Previously approved version (24 Jul 2012 15:14) is available.
This is an old revision of the document!
Table of Contents
ADIS16448 EVALUATION ON THE EVAL-ADIS
OVERVIEW
The ADIS16448 is a low-profile, high-peformance IMU that uses a serial peripheral interface for data communications. This interface enables direct connection with a large variety of embedded processor products. This electrical connection typically only requires 5 I/O lines for sychronous data collection, as show in the following figure:

ADIS16448/PCB BREAKOUT BOARD
For those who are on a tight timeline, connecting the ADIS16448 to an embedded controller will provide the most flexibility in developing application firmware and will more closely reflect the final system design. The ADIS16448/PCBZ is the breakout board for the ADIS16448 and may provide assistance in the process of hooking it up to an existing embedded processor system. For more information on the ADIS16448/PCBZ breakout boards, check out the following link: ADIS1648/PCB Breakout Board Web Page.
EVAL-ADIS: PC EVALUATION
For those who would prefer to perform PC-based evaluation of the ADIS16448, before developing their own embedded system, the EVAL-ADIS is the appropriate system to use. The remainder of this Wiki site will focus on PC-based evaluation with the EVAL-ADIS system.
EQUIPMENT LIST
SYSTEM REQUIREMENTS
Windows XP, Vista, 7
.NET Framework 3.5
NOTE: Newer versions of the .NET framework do not currnently support the IMU Evaluation software pacakge.
PHYSICAL SETUP
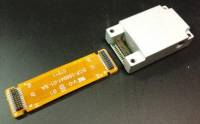
The ADIS16448/PCBZ includes one interface PCB, one flexible cable/connector and one ADIS16448AMLZ unit. Use the flexible cable/connector to install the ADIS16448 onto the EVAL-ADIS, using the following five steps. Set interface PCB aside, as it is not used for connecting the ADIS16448AMLZ to the EVAL-ADIS.
NOTE: Do not plug the EVAL-ADIS into the USB cable at this stage of the setup. Wait until the software installation is complete.
Step #1
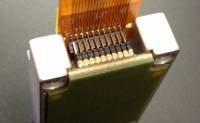
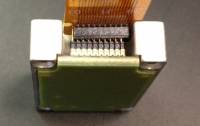
Install the flexible cable onto the ADIS16448AMLZ. The following pictures provide a visual refernece for correct connection.


WARNING: Make sure that the connector is in proper alignment before pressing it in. Misalignment can cause pin damage and exposure to harmful conditions. The following pictures provide visual examples of INCORRECT PIN ALIGNMENT. The most common alignment issues will cause the top view to look different than the third picture, shown directly above this paragraph.
Step #2
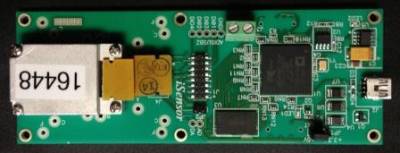
Connect the other end of the flexible cable to the EVAL-ADIS, using J4, pins 1-20. J4 has 24 pins, so make sure that the flexible cable connects only to pins 1-20 on J4.


Step #3
Slide the ADIS16448AMLZ body towards J4, while tucking the excess flexing under the connector interface, as show in the following pictures.


Step #4
Secure the ADIS16448AMLZ body, using (4) M2x0.4x10mm machine screws (included with EVAL-ADIS) and the “E” mounting holes (EVAL-ADIS labels for mounting holes).

Step #5
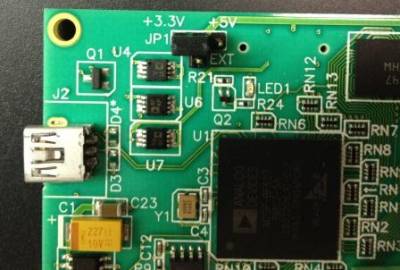
Set JP1 (EVAL-ADIS) to “+3.3V.”
IMU EVALUATION SOFTWARE INSTALLATION
Click here to download the IMU Evaluation software to a personal computer, which enables PC-based evaluation of the ADIS16448 on an EVAL-ADIS evaluation system. The download file will contain three separate files: The USB driver (SDPDrivers.exe), the application file (IMUEvaluation.exe) and the revision table. Copy these files to a convenient folder for running the application from.

USB Driver Installation
The SDPDrivers.exe file contains USB drivers that are compatible with both 32-bit and 64-bit Windows systems. Double-click on the SDPDrivers.exe file and follow the prompts to install the USB driver files onto the PC. When the following window appears, click on Next and then click on Install to continue with the installation.


The following pictures show the progress bar and the final confirmation window. Click on Finish to complete the installation.


IMU EVALUATION SOFTWARE GUIDE
After the USB driver installation is complete, connect the EVAL-ADIS USB connector to the PC, using the USB Mini cable, from the EVAL-ADIS kit. LED2 will illuminate as soon as this connection is made. This indicates that the EVAL-ADIS has power and is going through its start-up/initialization process. After the EVAL-ADIS completes its this process, LED1 will illuminate, indicating that it is time to launch the IMU Evaluation application. During the initialization process, several messages may appear on the screen. They are related to updating the EVAL-ADIS firmware and establishing communication between the PC and the EVAL-ADIS. Once LED1 lights up, double click on the IMU_Evaluation.exe file to launch the application.
Main Window
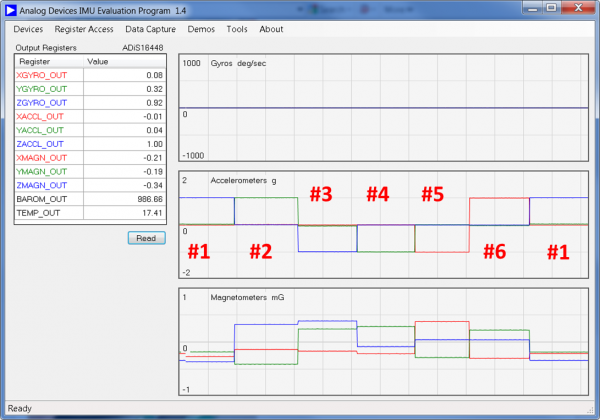
Once the IMU Evaluation software starts-up, the Main Window will appear and look like the following picture. The second picture provides color-coded boxes to support further discussion of each function in this screen.


The orange box identifies the drop-down menus, which provide a number of useful features. The Devices option provides a list of products. For ADIS16448 Evaluation, click on Devices and then select ADIS16448. The green box shows the current device selection, which in this case, identifies the ADIS16448 as the current selection.
The Register Access option provides a listing of user-configurable registers in the ADIS16448 and also provides read/write access to each one of these registers.
The Data Capture option provides the core data collection function.
The Demos option does not support the ADIS16448.
The Tools option provides some diagnostic tools for the USB interface.
The About option provides more detail software revision information.
The purple box identifies the output registers, which update, real-time, after pressing the Read button (see the red box for the location of the Read button).
The yellow box identifies the three waveform recorder windows. The top window contains the three gyroscope outputs. The middle window contains the three accelerometer responses. The bottom window contains the three magnetometer responses. Also, each waveform matches the color of its register (see register titles in the purple box).
Register Access
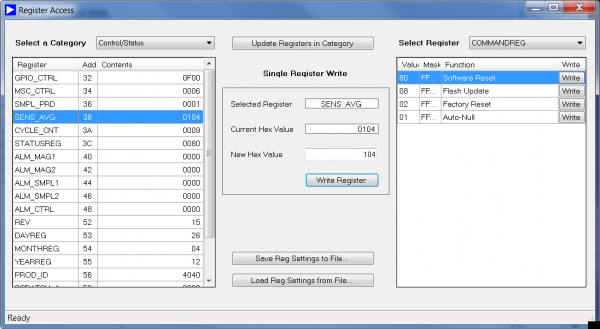
The purpose of the Register Access window is to provide both read and write access to the user registers in the ADIS16448. The following picture shows the appearance of this window.
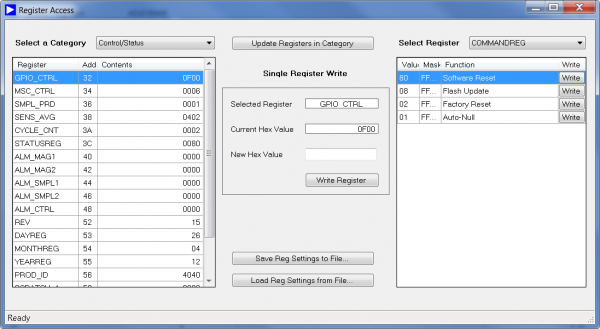
The color coded boxes illustrate the different functions that this window provides.

The purple box identifies the register category. In addition to the Control/Status, this drop-down control offers access to Output and Calibration registers.
The red box identifies all of the registers that are in the current category. Click on the register name to select a register for individual read/write access.
The green box identifies the read/write control options for the current register selection. Use the hexadecimal format when writing commands to a particular register.
The Update Registers in Category button (orange box) triggers a read and display update of all registers in the current category (red box).
The yellow box identifies the area that provides single-bit command buttons, such as the ones provided by the GLOB_CMD register.
The Save Reg Settings to File command saves all of the registers in the current category into a *.csv (common-delimited) file. The Load Reg Settings from File button reads those settings back into the software package and triggers a routine that updates all registers with the values from this file.
APPLICATION TIP: The Register Acess screen writes to user control registers, inside of the ADIS16448, two bytes at a time. So, when configuring a register, make sure to include the hexadecimal number for all 16-bits, before pressing the Write Register button. When using an embedded processor to write to user control registers, inside of the ADIS16448, each command (16-bits) writes to one byte at a time.
Data Capture Menu
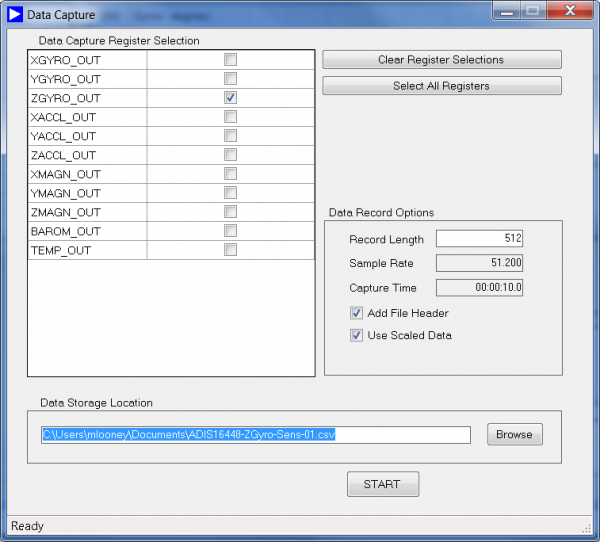
The Data Capture function supports synchronous data acquisition, based on the data-ready signal from the ADIS16448. The following picture represents the Data Capture window, right after opening it from the Main Window and the second picture provides color-coded boxes, in order to support further discussion of each function that is associated with this screen.


The red box identifies all of the registers that are eligible for inclusion in the next acquistion process. Click on each box to include a register in the next data acquistion sequence. The box will have a check mark when it has been selected.
The green box identifies the configuration box for the name and location of the data storage file.
The yellow box identifies a number of configuration options for the data acquisition process. The Record Length is a user input for the total number of samples in a data record. Note that all selected registers will have this number of samples in the data record file, after the acuistion process completes. The Sample Rate represents the rate that the ADIS16448 updates its output register. This depends on the configuration in the SMPL_PRD{12:8] bits. For example, if SMPL_PRD = 0x0801, bits 12:8 represent a decimation setting of 8, which would result in an update rate of 102.5 SPS. After each update to the Record Length box, the software calculates the displays the total Capture Time. The Add Header option allows the user to add or remove the header in the data storage file. The Use Scaled Data causes the software to convert the decimal, twos omplement number into its representatiive value. For example, when enabling Use Scaled Data, the gyroscope outputs will be in units of degrees/second.
EXAMPLE EVALUATION EXERCISES
Gyroscope Demonstration
The following example provides a simple demonstration example, for illustrating the gyroscope response to simple rotation.

In order to re-create the z-axis gyroscope (blue waveform, top plot) response, click on Read button and rotate the ADIS16488/EVAL-ADIS, in the manner that the following picture illustrates. Perform a couple of rotation cycles and then hit Stop.

In order to re-create the x-axis gyroscope (read waveform, top plot) response, click on Read button and rotate the ADIS16488/EVAL-ADIS, in the manner that the following picture illustrates. Perform a couple of rotation cycles and then hit Stop. Note that using both both thumbs, to fix the pivot point, typically helps produce a response that is closer to “x-axis only.”

In order to re-create the y-axis gyroscope (green waveform, top plot) response, click on Read button and rotate the ADIS16488/EVAL-ADIS, in the manner that the following picture illustrates. Perform a couple of rotation cycles and then hit Stop. Note that using both both hands, to fix the pivot point, typically helps produce a response that is closer to “y-axis only.”

The purpose of these simple exercises is to develop an intuition the sensor's response to motion. For those who develop their own clever demonstration ideas, post them in the Engineer Zone-MEMS Community.
Accelerometer Demonstration, Gravity
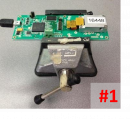
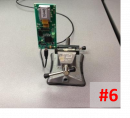
The ADIS16448 accelerometers response to gravity, in a manner that is consistent with Figure 17, on page 12 of the ADIS16448 datasheet. Use the Waveform Recorder to verify the accelerometer responses in six different orientations. In this exercise, place the ADIS16448/EVAL-ADIS flat on a table, or in a small vice, as shown in the following picture. Then, click on Read, wait for the curves to reach two divisions and then click on Stop. Repeat this process, using the following pictures, which represent a total of six orientations, including #1


Complete the exercise by returning to orientation #1 for the final two divisions on the waveform recorder screen and the final result will look like this.
Accelerometer Demonstration, Dynamic
Note that this exercise is just an example of how to develop an understanding of how the accelerometers will respond to dynamic motion. There are an infinite number of ways to do this. Keep in mind that the sample rate for the waveform recorder is fairly low, so keep your motion slow, so that you do not miss a leading edge of your motion and get fooled into thinking that the orientation is the opposite of what you expect. While this exercise uses the waveform recorder, the Data Capture function will provide higher sample rates and time resolution for transient movements.
Click on Read and hold the ADIS16448/EVAL-ADIS flat in your hand, with the USB cable pointed to the right and the ADIS16448 pointed up. Swing the device in a clock wise direction, in a manner that is similar to a big wave to someone. At the end of the clockwise wave, you will want the ADIS16448/EVAL-ADIS to be pointed down. Then swing the ADIS16448/EVAL-ADIS back in a counter-clockwise direction and when the device is back in its original orietnation, click on Stop. The following picture provides an example of what the waveform recorder will look like during this exercise. Notice the positive z-axis response on the leading edge of the response (blue curve) of the clockwise rotation. On the backswing, the rotation is counter-clockwise and the z-axis response leads with a negative transient.

Gyroscope Bias Correction
The ADIS16448 datasheet (page 19, revision 0) offers a three-step process for gyroscope bias correction. This exercise implements these steps, using the ADIS16448/EVAL-ADIS.
STEP #1: Set SENS_AVG = 0x0104
From the Main Window, click on the Register Access option. Once this window is open, select the SENS_AVG regsiter and write “104” in the New Hex Value box, as shown in the following figure. Then click on Write Register. Notice that the register contents box changes at the conclusion of the write cycle.

APPLICATION TIP: When writing to the SENG_AVG register, using an embedded processor, write to the upper byte first, using DIN = 0xB801 (SENS_AVG[15:8] = 0x01) and the ADIS16448 will automatically update the lower byte to 0x04.
STEP #2: Set SMPL_PRD = 0x0x1001
Stay in the Register Access window and click on SMPL_PRD, type 1001 into the New Hex Value box and then click on Write Register. Notice that the register contents box changes at the conclusion of the write cycle.

STEP #3: Set GLOB_CMD = 0x0001 (Start Auto-null)
Wait 3 minutes for the internal bias estimate to stabilize and stay in the Register Access window. Once the 3 minute waiting period has completed, click on the Write button, located next to the AutoNull, on the right side of the screen.

After the calibration function completes, all of the register values on the screen will automatically refresh. Click on the Calibration register category to observe the updated values in the xGYRO_OFF registers.
WAITING FOR SOFTWARE UPDATE TO PROVIDE THIS FIGURE
APPLICATION TIP: The GLOB_CMD register access is managed in a separate box, to help manage the processing time associated with each single-command. When starting an auto-null function with an embedded processor, set DIN = 0xBE01 (GLOB_CMD[7:0] = 0x01) and wait at least 75ms before writing another commmand to the SPI interface.
Gyroscope Sensitivity
For extensive characterization of sensitivity or linearity, over a broad range of conditions, a motor stage with encoder feedback offers the most efficient and accurate approach. For limited conditions, one can employ a simpler approach that involves reading the gyroscope output data while rotating it around a fixed angle. After finishing the motion and data collection, one can calculate the displacement angle by adding all of the gyroscope measurements together and then dividing that sum by the sample rate. Here is a summary of the approach used in this exercise:
1. Use an ADIS16448/EVAL-ADIS and the IMU Evaluation software.
2. Use the edge of a table as a reference, to rotate the ADIS16448/EVAL-ADIS 360 degrees around the z-axis, while capturing data. Since the ADIS16448/EVAL-ADIS will end up in the same place that it started, it is easy to assure an accurate 360 degree turn.
3. Use a range setting of +/-1000 deg/sec (SENS_AVG[15:8] = 0x04).
4. Use a sample rate of 51.2SPS (SMPL_PRD = 0x0401).
5. Capture 10 seconds worth of data.
Start by using the Register Access screen to write the appropriate values to SMPL_PRD (0x0401) and SENS_AVG (>0x0400). After updating these registers, close the Register Access screen and open the Data Capture screen. Select the ZGYRO_OUT box and duplicate all of the settings in the following picture. The filename and location can be different than shown on in this picture.
After the Data Capture settings match the settings in the above picture, position the ADIS16448/EVAL-ADIS so that one of the long PCB edges is in alignment with a table edge. Practice rotating it a full 360 degrees within 10 seconds. Try to avoid rapid changes in the rate of rotation. This may take a few trials to find the right motion and direction. Once comfortable with the approach, click on Capture and rotate the ADIS16448/EVAL-ADIS a full 360 degree and make sure it is in alignment with the same edge that it started on.
REFERENCES
For more information on this approach to measuring sensitivity, click on the following technical article link:
Gyroscope/Accelerometer Noise
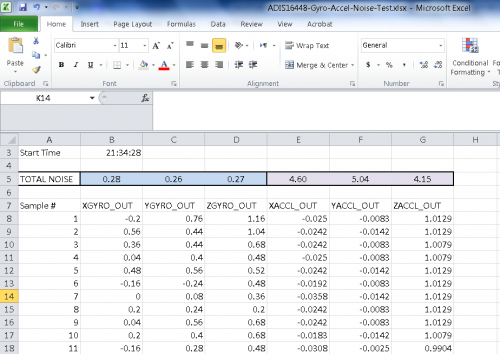
In order to test the full-bandwidth, total noise in the ADIS16448 gyroscopes and accelerometers, use the Register Access menu to set SMPL_PRD = 0x0001 and SENS_AVG = 0x0400. Then, go into the Data Capture menu and duplicate the settings in the following picture. Click on Start to collect the data and then open the data-log file in MS Excell to analyze the total noise for each axis, using the STDEV command inside of Excel. Make sure that the ADIS16448 is on a stable surface when performing this exercise.

Note that all six sensors display noise that is consistent with the total noise specificaitons in the ADIS16448 datasheet.
In-run Bias Stability
For the ADIS16448 gyroscopes and acceleroemeters, “In-run Bias Stability” refers to the best resolution available, when averaging sequetital, time domain data. This has a direct impact on the accuracy of a bias correction and therefore, has a direct impact on angle measurement drift. In reviewing the Allan Variance curve for the gyroscopes (Figure 7), the minima of the the best performance curve (mean - 1 sigma) is associated with an integration time of ~100 seconds. However, many of the units (from mean and mean + 1 sigma curves)) start approaching their minima at ~40 seconds. While selecting the best settings may require some iteration, this exercise starts with an integration of 40 seconds, an output data rate of 51.2 SPS (SMPL_PRD = 0x0401) and a dyanmic range of +/-250 degrees/second (SENS_AVG = 0x0104).
Here is a snapshot of the Data Access and Data Capture screens, which configures the software to take 50 sets of z-axis gyroscope data, that contain 40-second time records each, at a read rate of 51.2SPS.


Click on the following link, for an example data file, with a manual calculation of the Allan Variance, at 40 seconds of integration time. In this file, you will find the test unit exhibited ~13 deg/hour of in-run bias stability. In this file, use the following reference points:
Column A = Sample number
Column B = Gyroscope output data
Column C = 40-second average, starting at row 2053
Colum D = Square of the mean difference
Cell F2 completes the Allan Variance computation
Angle Random Walk
Additional details are coming soon.
resources/eval/user-guides/inertial-mems/imu/adis16448.1344031768.txt.gz · Last modified: 04 Aug 2012 00:09 by Mark Looney