


This version (19 Apr 2021 14:34) was approved by Hannah Rosete.The Previously approved version (11 Jan 2021 08:54) is available.
Table of Contents
General Settings - Test Case
Initial Setup
In order to proceed through the test case, first of all delete the Scopy *.ini file (saves previous settings made in Scopy tool) from the following path on Windows: C:\Users\your_username\AppData\Roaming\ADI .
Open Scopy instrument. The interface should look like the pictures below:


Test Case
Installation
Click to display ⇲
Click to hide ⇱
| Description | Test Steps | Steps Resources | Expected Results |
|---|---|---|---|
| Installation | 1.1 If you have a different version of Scopy installed before, please uninstall along with the M2K drivers. Open Control Panel\All Control Panel Items\Programs and Features, find Scopy, and click “Uninstall.” |  | A dialog box will open asking if you want to uninstall Scopy and all of its contents. Upon clicking “Yes”, Scopy must be properly uninstalled. |
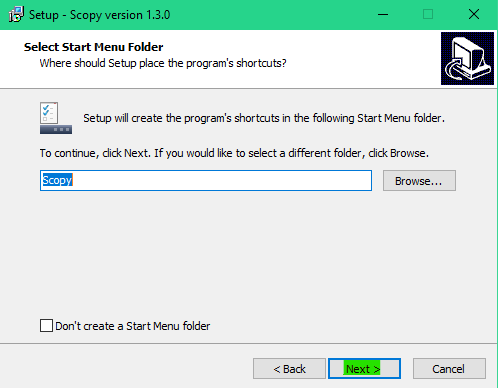
| 1.2 Download Scopy’s latest release on GitHub (https://github.com/analogdevicesinc/scopy/releases) and run. Follow the images of the promptings on the right for reference: |  | The prompts’ sequence will be the same as the ones posted here in the Step Resources. | |
 |
|||
 |
|||
| Drivers for ADALM2000 | 1.3 If you want to automatically install the ADALM2000 drivers, check the box indicating “Install drivers for ADALM2000” and click “Next.” | 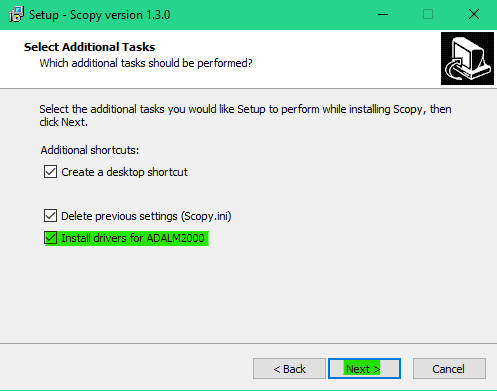 | The prompt will look like the Step Resources picture. |
| 1.4 If you want to manually install the ADALM2000 drivers, uncheck the box indicating “Install drivers for ADALM2000” and click “Next.” Go to this link (https://github.com/analogdevicesinc/plutosdr-m2k-drivers-win/releases) to find your preferred version of ADALM2000 drivers. |  | The prompt will look like the Step Resources picture. | |
| Installation | 1.5 Continue with the installation by following the promptings. |  | The prompts’ sequence will be the same as the ones posted here in the Step Resources. |
 |
|||
 |
|||
| 1.6 After Scopy finishes its installation, a different dialog box will open – the Device Driver Installation Wizard. | 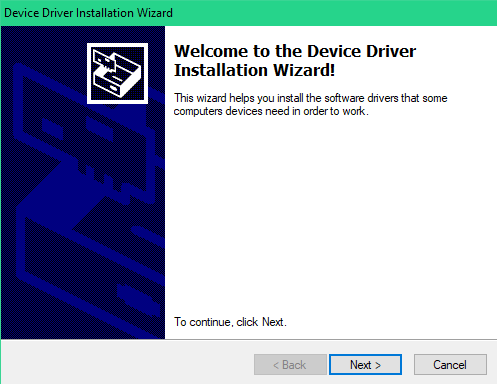 | The prompts’ sequence will be the same as the ones posted here in the Step Resources. | |
 |
|||
 | After completion, the “Device Driver Installation Wizard” dialog box will automatically close and direct you back to the Scopy installation setup. | ||
| Completing the Scopy Setup Wizard | 1.7 To use the application immediately, choose the “Yes, restart the computer now” option and click “Finish.” |  | The prompt will look like the Step Resources picture. |
| 1.8 If you opt to use the application for later, choose the “No, I will restart the computer later” option and click “Finish.” | 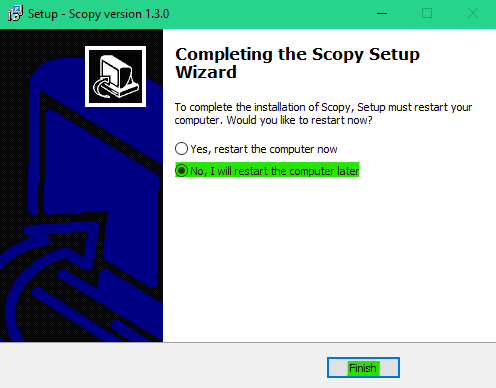 | The prompt will look like the Step Resources picture. |
M2K Connection and Calibration
Click to display ⇲
Click to hide ⇱
| Description | Test Steps | Steps Resources | Expected Results |
|---|---|---|---|
| Connect and Auto Calibration feature using local connection | 2.1 Connect the M2K board to the PC using a micro-USB connector. |  | The set up should look like the Steps Resources picture on the left. |
| 2.2 Click the M2K icon. |  | The instruments will appear on the left panel: Oscilloscope, Spectrum Analyzer, Network Analyzer, Signal Generator, Logic Analyzer, Pattern Generator, Digital IO, Voltmeter, and Power Supply. | |
| 2.3 Click “Identify.” | The “Ready” LED on the M2K board will rapidly blink 10 times indicating that it is the device identified by Scopy. | ||
| 2.4 Click “Connect.” |  | M2K will auto calibrate. The calibration indicator on Oscilloscope, Spectrum Analyzer, Network Analyzer, Signal Generator and Voltmeter instrument should start. “Calibrate” button must be enabled. | |
| Manual Calibration feature using local connection | 3.1 After connecting the M2K, manually calibrate the device by clicking the “Calibrate” button. | M2K will calibrate. The calibration indicator on Oscilloscope, Spectrum Analyzer, Network Analyzer, Signal Generator and Voltmeter instrument should start. | |
| Connect and Auto Calibration feature using remote connection | 4.1 On the home menu, click the add “+” button and input the IP address of the desired M2K board to control. The default IP address is 192.168.2.1. Click add. |  | The set up should look like the Steps Resources picture on the left. The instruments will appear on the left panel: Oscilloscope, Spectrum Analyzer, Network Analyzer, Signal Generator, Logic Analyzer, Pattern Generator, Digital IO, Voltmeter, and Power Supply. |
| 4.2 Click “Identify.” | The “Ready” LED on the M2K board will rapidly blink 10 times indicating that it is the device identified by Scopy. | ||
| 4.3 Click “Connect.” |  | M2K will auto calibrate. The calibration indicator on Oscilloscope, Spectrum Analyzer, Network Analyzer, Signal Generator and Voltmeter instrument should start. “Calibrate” button must be enabled. | |
| 4.4 Click “Forget device.” | The M2K board icon connected remotely will disappear on the panel. | ||
| Manual Calibration feature using remote connection | 5.1 After connecting the M2K, manually calibrate the device by clicking the “Calibrate” button. |  | M2K will calibrate. The calibration indicator on Oscilloscope, Spectrum Analyzer, Network Analyzer, Signal Generator and Voltmeter instrument should start. |
Save and Load Profile
Click to display ⇲
Click to hide ⇱
| Description | Test Steps | Steps Resources | Expected Results |
|---|---|---|---|
| Save and Load Profile feature | 6.1 Save the current profile. On the bottom part of the left panel, click the “Save” icon and save the profile as “default.ini.” Change any setting on any instrument and reload the profile. |   | The change made on a certain instrument should be undone and the default profile should load. |
| Save and Load Profile feature: Signal Generator, Oscilloscope and Spectrum Analyzer | 6.2 Oscilloscope’s Settings: |  | See Step Resource Picture for reference. |
| a. For Channel 1: Time Base: 100ns, Volts/Div: 2V | |||
| b. For Channel 2: Volts/Div: 5V | |||
| Signal Generator’s Settings: | |||
| a. For Channel 1: Sinewave, 3Vpp, 3MHz | |||
| b. For Channel 2: Square Wave, 5Vpp, 900kHz | |||
| Spectrum Analyzer’s Settings: | |||
| a. Frequency Sweep Setting: Start – 500kHz; Stop – 5MHz | |||
| b. Amplitude: Top – 10dBFS; Bottom – -140dBFS | |||
| 6.3 Connnect AWG channel 1 to Scope Ch1+ and AWG channel 2 to Scope Ch2+. Connect Scope Ch1- and Ch2- to GND. |  | See Step Resource Picture for reference. | |
| 6.4 Run the Signal Generator instrument, and check the output on Oscilloscope and Spectrum Analyzer. Then save the profile as “profile1.ini “ | The output waveform on the Oscilloscope should be set in a way that the signals are can properly be seen compared with the default settings. In the Spectrum Analyzer the fundamental frequency of both signals should be present in the plot window set by the sweep setting. | ||
| 6.5 Reload the default setting by deleting the file in C:\Users\your_username\AppData\Roaming\ADI. Reload “profile1.ini” and run the signal generator and oscilloscope or Spectrum Analyzer | The result should be the same on the saved profile. | ||
| Save and Load Profile feature: Logic Analyzer, Pattern Generator and Digital IO | 6.6 Pattern Generator’s Settings: | ||
| a. Enable DIO2, DIO3, DIO6, DIO7, DIO10, DIO11, DIO14 and DIO15. | |||
| b. Group DIO1 and DIO2 set to random and 1MHz frequency. | |||
| c. Group DIO10 and DIO11 and set to Binary Counter at 1MHz. | |||
| d. Set the other enabled DIOs to clock at 1MHz. | |||
| Logic Analyzer’s Settings: | |||
| a. Group DIO0, DIO1, DIO4, DIO5, DIO8, DIO9, DIO12, and DIO13 and set to parallel mode. | |||
| b. Group DIO2 and DIO3 and set to parallel mode. | |||
| c. Group DIO10 and DIO11 and set to parallel mode. | |||
| d. Set the time base to 1us. | |||
| Digital IO’s Settings: | |||
| a. Set DIO0, DIO1, DIO4, DIO5, DIO8, DIO9, DIO12, and DIO13 to output. | |||
| 6.7 Run the three instrument and open Logic Analyzer instrument. Save the profile as “profile2.ini”. |  | See that the profile is saved on the desired location and the logic analyzer should be set in a way that the rising and falling edge of the signal is clearly seen. | |
| 6.8 Reload the default setting by deleting the file in C:\Users\your_username\AppData\Roaming\ADI. Reload “profile2.ini”, and run Pattern Generator, DigitalIO and Logic Analyzer. |  | The result should be the same on the saved profile. | |
| Save and Load Profile feature: Power Supply, Voltmeter and Network Analyzer | 6.9 Power Supply’s Settings: |  | See step resource picture for reference. |
| a. Set to “Tracking Mode” with 35% tracking setting. | |||
| b. Set positive supply to 3V and the negative supply should automatically be set to -1.05V. | |||
| Signal Generator’s Settings: | |||
| a. For Channel 1: Sinewave, 2Vpp, 10kHz | |||
| b. For Channel 2: Sinewave, 1Vpp, 10kHz, 90deg phase | |||
| Voltmeter Settings: | |||
| a. For Channel 1: DC (Direct Current), History – OFF | |||
| b. For Channel 2: AC (20Hz – 40kHz), History – ON (1s) | |||
| Network Analyzer: | |||
| a. Reference: Channel 1, 2V Amplitude | |||
| b. Sweep: Linear, Start – 1kHz, Stop – 100kHz, Sample Count – 200 | |||
| c. Display: Min. Magnitude – -90dB, Max. Magnitude – 10dB, Min. Phase – -100deg, Max. Phase – 100deg | |||
| 6.10 Connect Positive Supply to Scope Ch1+, connect AWG1 to Scope Ch2+, connect scope Ch1- and Scope Ch2- to GND |  | See Step Resource Picture for reference. | |
| 6.11 Run Power Supply, Voltmeter and Signal Generator to see if the voltmeter will be able to read 3V on channel 1 and 0.7V on channel 2. Save the profile as “profile3.ini”. |  | Channel 1’s history should be off and channel 2’s history should be present and the reading must be stable. | |
| 6.12 Reload the default setting by deleting the file in C:\Users\your_username\AppData\Roaming\ADI. Reload “profile3.ini”, and run Power Supply, Voltmeter and Signal Generator. | The result should be the same on the saved profile. The network analyzer’s setting should be retained. |
Preferences
Click to display ⇲
Click to hide ⇱
| Description | Test Steps | Steps Resources | Expected Results |
|---|---|---|---|
| Preferences Features | 7.1 Click the Preferences option located below the instrument options. | «change picture» | The Preferences menu should contain seven sections: General, Oscilloscope, Spectrum Analyzer, Logic Analyzer, Signal Generator, Network Analyzer, and Debug. Please see the step resource image for reference. |
| General | 7.2 Enable “Save session when closing Scopy.” | «put picture» | |
| 7.3 Use Scopy and play with its instruments, changing the configurations and settings. Close Scopy and reopen. | «put picture» | ||
| 7.4 Enable “Show advanced device information.” | «put picture» | ||
| 7.5 On the Home menu, click the M2K icon and drag down to see the advanced device information. | «put picture» | ||
| Reset profile to default by deleting the files from C:\Users\your_username\AppData\Roaming\ADI . Disable auto save feature. Load profile 1, profile 2 or profile 3 from Testing Save and Load feature steps. Close Scopy and Open. | Reopening Scopy, the profile loaded should be the default one. | ||
| Reset profile to default by deleting the files from C:\Users\your_username\AppData\Roaming\ADI . Enable auto save feature. Load profile 1, profile 2 or profile 3 from Testing Save and Load feature steps. Close Scopy and Open. | Reopening Scopy, the profile loaded should be the profile saved. | ||
| Following step 7.7, open Scopy and the current profile should be one of the profiles created from the Save and load test case. On the General Setting preference, the reset scopy is located in the lower right of the Scopy screen. Click reset scopy. |  | A dialog box should appear confirming the reset command. Scopy should return to its default setting. Similar with deleting the files from C:\Users\your_username\AppData\Roaming\ADI folder. | |
| Oscilloscope | Under the Oscilloscope section, labels on the plot may be toggled on or off. |  | Checking the Oscilloscope plot, the labels must synchronize with the option chosen. See Step Resource image for reference |
| Spectrum Analyzer | On the Spectrum Analyzer section, an option to search or not to search marker peaks in the visible domain is given. |  | See Step Resource Picture for reference. |
| Signal Generator’s Settings: |  | See Step Resource Picture for reference. | |
| a. For Channel 1: Sinewave, 10Vpp, 500kHz | |||
| Spectrum Analyzer’s Sweep Settings: | |||
| a. Start – 700kHz, Stop – 1MHz | |||
| b. Disable Channel 2. | |||
| Connect AWG channel 1 to Scope Ch1+ . | |||
| Under the Marker Settings, click Marker 1 then “Peak.” Turn the Marker Table on and look for the marked frequencies. |  | A marker labeled M1 will automatically appear on the spectrum upon clicking Marker 1. Clicking “Peak” will put the Marker on the 500kHz mark. | |
| Signal Generator | 7.7 Under the Signal Generator section, The number of periods shown may be adjusted from 2 to 9. |  | The signal generator’s graphical representation must follow the desired number of periods on the lower frequency channel (if both channels are configured to output waveform signals). When numbers other than 2 to 9 are entered, the number and the line under it turns to red. See Step resource image for reference. |
 |
|||
 |
|||
| Network Analyzer | On the Network Analyzer section, an option to display 0dB on the graph is available. Click to enable it. |  | See Step Resource Picture for reference. |
| Construct a first-order low pass RC filter with the following components: R = 470 Ohms, C = 1uF. This will have a cut-off frequency of ~340 Hz. |  | The set up should look like in steps resources picture on the left. | |
| Network Analyzer’s Settings |  | The Bode Plot has 0dB on its labels. See Step Resource Picture for reference. | |
| a. Reference: Channel 1, 1V Amplitude, 0V Offset | |||
| b. Sweep: Logarithmic, Start – 10Hz, Stop – 500kHz, Sample Count - 100 | |||
| c. Display: Min. Magnitude – -90dB, Max. Magnitude – 10dB, Min. Phase – -150deg, Max. Phase – 60deg | |||
| d. Run Network Analyzer |
Test index_file parameter
Click to display ⇲
Click to hide ⇱
| Description | Test Steps | Steps Resources | Expected Results |
|---|---|---|---|
| Test index_file parameter | 8.1 Go to ADALM2000's wiki page and save it as html. |  | Take note of the directory of the saved html file. See Step Resource Image for reference. |
| 8.2 Save a Scopy profile and open using notepad. Set the index_file parameter to the directory of the html file. Make sure to follow the correct format. |  | See Step Resource Image for reference. | |
| 8.3 Load the edited Scopy profile. |  | ADALM2000’s wiki page is loaded on the Scopy’s home screen. See step resource image for reference. | |
| 8.4 Repeat steps 1 to 3 on different sites such as Analog's Main page and other trusted web sites | The html version should appear on Scopy's home. |
Test Results will be recorded in the following document: General Setting Test Case
Return to Test Cases Table of Contents
university/tools/m2k/scopy/test-cases/general-settings.txt · Last modified: 19 Apr 2021 14:23 by Hannah Rosete