


This version is outdated by a newer approved version. This version (30 Jun 2021 13:28) was approved by Ciaran Watterson.The Previously approved version (03 Jan 2021 21:46) is available.
This version (30 Jun 2021 13:28) was approved by Ciaran Watterson.The Previously approved version (03 Jan 2021 21:46) is available.This is an old revision of the document!
Table of Contents
DPG Lite
DPG Lite is used to download data to supported HS-DAC evaluation boards. Refer to your evaluation board user guide if you need to use DPG Lite.
Known Issue: ACE may fail to detect HS-DAC boards, details here.
Supported Evaluation Boards
The supported DAC evaluation boards are:
- AD9129/19
- AD9122/21/25
- AD9135
- AD9136
- AD9142A
- AD9144
- AD9162/1/3/4
- AD9172/1/3/4/5/6
- AD9739A/7A
- AD9747/6/5/3/1
- AD9783/81/80
- AD9717/16/15/14
- AD9117/16/15/14
- AD9707/06/05/04
- AD9736/35/34
- AD9779A/78A/76A
- AD9146
- AD9739/37
- AD9788/87/85
- AD9748/44/42/40
- AD9767/65/63/09
- AD9081/82
- AD9986/88
Evaluation boards must be attached to a controller board. The controller board is used to store and transmit the data to the DACs under test. The supported controller boards are:
- DPG3
- SDP-H1
- ADS7
- ADS8
- ADS9
Refer to the DAC evaluation board user guide to choose the correct controller board to associate with the evaluation board.
Installation

Running DPG Lite
A shortcut will be installed to your start menu named “DPGDownloaderLite” in the Analog Devices shortcut folder.
The Main Screen
The Main Screen is divided into two sections. The top section allows you to add data vectors to DPG Lite. The bottom section displays a panel for the attached controller and evaluation boards.

To begin, add data vectors to the application. Once the vectors have been setup, the boards can be configured, the vectors can be downloaded into the controller board's memory and played to the DACs under test.
Refer to the evaluation board user guide to learn more about how to configure it in DPG Lite.
The rest of this guide will go over how to generate data vectors.
Data Vectors
Adding Vectors
Data vectors are added to the main screen before they can be used with a board. This allows the same data to be used for multiple channels and multiple boards without duplicating the memory requirements on the PC. Data vectors can be loaded in from an existing file, or they can be generated by the DPG Lite directly.
Buttons
 | Adds a vector from an existing file. See Loading Data Files for more information. Clicking the down arrow will display a list of the last 10 data files that were loaded. |
 | Displays a drop-down list of the available vector generators. See Generating Data Vectors for more information. |
 | Removes the selected vector. The selected vector is highlighted with a border. If the selected vector is from a data file, removing the vector from DPG Lite will not delete the file itself. The data file can be added back at any time. |
 | Removes all vectors from the list. |
 | Displays both a time-domain and frequency-domain graph of the selected vector(s). See Graphing Vectors for more information. |
Selecting Vectors
To remove a vector, or to graph a vector, it must be selected. To select a vector, click on its vector number on the left side of each vector. This will cause a colored border to be drawn around the vector, indicating it is selected. To select multiple vectors at once, hold down the Ctrl key while clicking on the individual vectors.
Loading Data Files
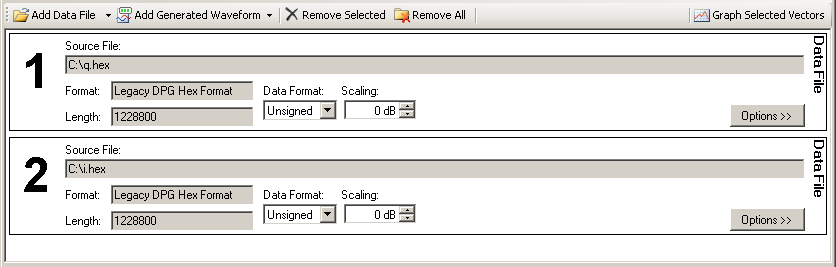
To add a data file, click on Add Data File. You will then be prompted to select which file to load. After selecting a valid file, an entry will be added to the Files List area. The item will initially be listed as “Processing”. During this time, DPG Lite is reading the contents of the data file, and determining certain statistics about the file. Once the file has been read in, the Processing text will disappear.
For each file listed, a Vector Number is displayed on the left. This number is only used to assist you when selecting the files to load into the board. The number will change depending on the order in which files are loaded in. The file name of the original data file path, the file format, and number of records (length) in the file are also listed.
For certain file types, a Resolution entry will also be displayed, to the right of the Scaling box. This is used to properly scale an unsigned vector around mid-scale, and when graphing the vector, to properly calculate dB full-scale. Set this to the equivalent resolution of the file. For example, if the file contains values between 0 and 16383, then the file would be 14-bit resolution.
To remove a data file, click on the entry once to highlight it. Once highlighted, click on Remove Selected. To remove all the listed data files, click Remove All.
Supported File Formats
| File Type | Extension | Multi-Channel |
|---|---|---|
| Legacy DPG Hex Format | .hex | No |
| Legacy DPG Text Format | .txt | No |
Example Vector Files
Generating Data Vectors
Several different vector generators are available from within DPG Lite. They are all available from the Add Generated Waveform drop-down list, which is located to the right of the Add Data File button.
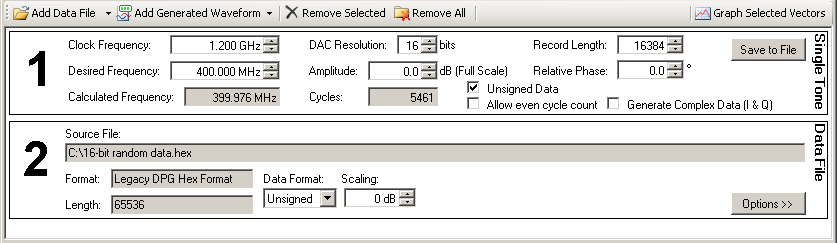
Single Tone

The Single Tone generator creates a simple sine wave vector. Enter the clock frequency of the data going into the DAC, the resolution (number of bits) of the DAC, as well as the desired frequency, amplitude, and relative phase of the sine wave. The generator will always generate vectors which can be looped repeatedly. To ensure contiguous waveforms over multiple loop iterations, the generator will calculate an achievable frequency that is as close to the desired frequency as possible. This frequency will be displayed in the Calculated Frequency box, as well as the number of complete cycles that will be generated in the vector. It may be possible to achieve a calculated frequency exactly equal to the desired frequency. Often, changing the record length is required for this to occur.
If either the Clock Frequency or Desired Frequency is invalid, the box will turn red. A vector will not be available until any red boxes have been corrected.
The “Unsigned Data” option should match the settings in the DAC. Most DAC's can be setup to accept unsigned (straight binary) or signed (2's complement) data.
The Single Tone generator can generate a quadrature (complex) tone in addition to the primary (in-phase) tone, by checking the “Generate Complex Data” option. This second (Q) tone is equal in frequency and amplitude to the primary (I) tone, but is 90° out of phase. By default, the Q tone is -90° relative to the I tone. Entering a negative frequency in the Desired Frequency box will cause the Q tone to be +90°.
The “Allow Even Cycle Count” check box allows the user to override the default settings of the tone generator and allow an even number of cycles per vector. This may lead to the appearance of degraded DAC performance, as only a subset of the DAC's full code range will be exercised. This has the effect of distributing the quantization noise over only those codes, resulting in degraded performance. It is highly recommended that this feature not be enabled.
Multi-Tone
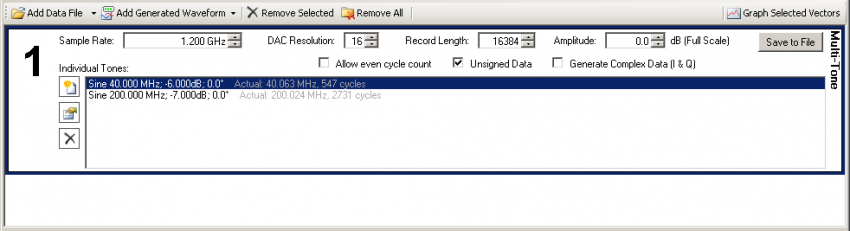
The Multi-Tone generator creates vectors that are composed of multiple sine wave vectors. Each tone can have its own frequency, amplitude, and phase. As with the Single Tone generator, the Multi-Tone generator always generates individual tones which will loop properly. In the tone list, the desired frequency and amplitude are listed first. In dark gray, the calculated frequency and number of cycles are displayed. If the tone cannot be generated (for example, the Sample Rate is too low), the tone will appear red in the tone list, and the dark gray text will change to an explanation of why the tone cannot be generated.
 | Add Tone: Click this button to add a new tone to the tone list. |
 | Edit Selected Tone: Click this button to edit the selected (highlighted) tone. |
 | Remove Selected Tone: Removes the selected tone from the tone list. |
When multiple sine vectors are summed together, the possibility for clipping (data out of range) occurs. When clipping is detected, a warning is displayed:

To correct this error, lower the amplitude of the overall vector, or lower the amplitude of the individual tones until the warning message disappears.
The Multi-Tone generator can generate a quadrature (complex) tone in addition to the primary (in-phase) tone, by checking the “Generate Complex Data” option. This second (Q) tone is equal in frequency and amplitude to the primary (I) tone for each individual tone, but is 90° out of phase. By default, the Q tone is -90° relative to the I tone. Entering a negative frequency in the Desired Frequency box will cause the Q tone to be +90°.
The “Allow Even Cycle Count” check box allows the user to override the default settings of the tone generator and allow an even number of cycles per tone per vector. This may lead to the appearance of degraded DAC performance, as only a subset of the DAC's full code range might be exercised. This has the effect of distributing the quantization noise over only those codes, resulting in degraded performance. It is highly recommended that this feature not be enabled.
DC

The DC generator generates a vector in which every element is the value specified in the Value box. The Value can be entered in Decimal or Hex (hexadecimal).
Noise Generator

The Noise Generator generates a vector with pseudo-random noise, by a variety of techniques. Gaussian, Uniform, and White Noise types are available.
Advanced Vector Generator
The Advanced Vector Generator libraries contain several generators for creating vectors that mimic waveforms found in common applications. These vectors go far beyond simple tone testing, allowing for data converter evaluation with spectrum-accurate vectors for many popular waveforms.
Installation
The Advanced Vector Generator libraries are installed optionally during ACE installation. They rely on the ADIThon software which license you'll have to agree to when installing it.
Cable Infrastructure
The Cable Infrastructure Advanced Vector Generator creates spectrum-accurate vectors which can be used to simulate a DOCSIS signal.

To begin, select the Standard for which you are trying to simulate. This will set the Symbol Rate and QAM constellation size appropriately. To set either of these manually, select Other as the Standard. Then select the Sample Rate. This will be fixed to an integer multiple of the Symbol Rate. Select the appropriate Resolution for the DAC which will be playing out this vector.
Adding Channels
Add channels to the vector by adjusting the parameters in the Add Channels section on the bottom of the panel, and click the Add Channels button. The number of channels available in a single vector is limited only by the available memory and processing power of the PC, however most users will find that a channel count of several hundred or more becomes cumbersome to work with.
To add a single channel, enter the Center Frequency and Relative Amplitude, while leaving the Number of Channels at 1. This will add one channel to the vector. This can be done as many times as needed to add all the required channels. The Relative Amplitude is the amplitude of the current channel relative to the other channels. For example, if all channels are at 0dB, they will all have the same amplitude. The absolute amplitude, as seen at the output of the DAC, will depend on the relative amplitude of each channel, the number of channels, the digital backoff (see below), and the transfer function of the DAC itself.
To save time, if a number of channels are to be added to the vector that are at a constant spacing from each other, the Number of Channels and Spacing options can be used. For example, to generate an 8-carrier vector, with each channel 6MHz away from the previous channel, select 8 for the Number of Channels, and 6MHz for the spacing. In this case, the Center Frequency is the center frequency of the first channel.
Each channel can be edited and deleted individually, regardless of if it was added individually or as a group.
Once a channel is added, the Actual frequency is displayed after the desired Center Frequency. This frequency is the closest frequency that could be achieved given the sample rate. Also displayed is the number of points the vector will produce. This determines how much memory the pattern generator will need in order to play out this vector, as well as indicate approximately how long the vector will take to generate and download.
Editing Channels
The Center Frequency and Amplitude of each existing channel can be edited by double-clicking on the respective entry in the list of channels. For example, to edit the Amplitude, double click on Amplitude: or the value after it in the list. This will allow the value to be edited. When you are done editing the value, click outside the edit box.
To remove a channel, single-click on the channel to highlight it, then press the Delete key (keyboard) or right-click and select Delete.
Double-clicking on the channel type (left-most entry per line) will bring up the properties box for that channel. Advanced options for the channel can be adjusted here.
The order that the channels are displayed in the list can be altered with the up and down arrows on the right side of the list. Highlight a channel, and press the up arrow or down arrow to move the channel. This will not affect the vector generation; it is for display purposes only.
Digital Backoff
When the vector is generated, the signal will be scaled such that the peak of the time-domain signal is at the full scale of the DAC (a value determined by the Resolution option). This ensures that the vector will never clip or roll over. To lower the amplitude of the vector beyond full scale, the Digital Backoff option can be used. This scaling is applied to the vector before it is sent to the DAC.
Note: Some DACs have a digital and/or analog backoff which is independent of this function. This vector backoff is applied before any backoff that the DAC may perform.
Generating the Vector
When the resulting data vector is requested, either to graph or to download to a board, it will be generated automatically. After it has been generated, the Peak to Average ratio (crest factor) will be displayed above the list of channels. Note that changing the channels will not update this value until the vector is generated again.
DOCSIS 3.0
Beyond the standard Center Frequency and Amplitude options, DOCSIS 3.0 channels have a number of other properties that can be adjusted. Double-clicking the DOCSIS 3.0 text in the channel list will bring up the Channel Properties box:

From here, a number of items can be viewed, and several items can be altered.
| Property | Description |
|---|---|
| Name | The internal name of the channel. This is displayed for debugging use only. |
| Number of Symbols | The calculated number of symbols in the vector. This is determined automatically. |
| Modulation Rate | The Modulation Rate is specified in the main window, but is displayed again here. |
| Center Frequency | The Center Frequency of the channel. Changing this value will update the main window as well. |
| Interpolation | The interpolation factor used internally to arrive at the specified sample rate. |
| Power Level | The relative amplitude of the vector. Changing this value will update the main window as well. |
| Alpha | Excess Bandwidth, specified by the DOCSIS standard for the configuration you are generating |
| Modulation | The modulation routine used, specified by the DOCSIS standard for the configuration you a generating. |
| Source | The source of the data which is modulated to form the DOCSIS channel. This is always set to Random. |
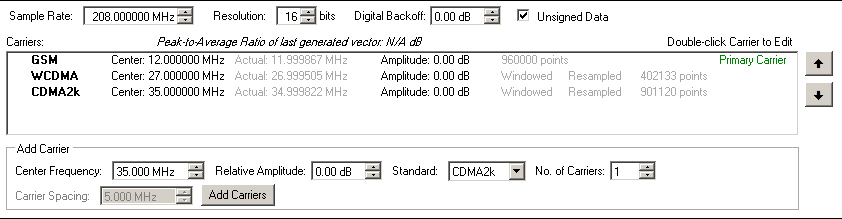
Wireless Infrastructure
The Wireless Infrastructure Advanced Vector Generator creates spectrum-accurate vectors which can be used to simulate a variety of carries commonly used in the Wireless/Cellular industries.
Multiple carrier types can be combined in a single vector. For example, one vector could contain both a GSM carrier and a WCDMA carrier. Multiple carriers of the same type are also allowed (for example: multi-carrier GSM).
Note: The vectors created with this tool are spectrally accurate. However, in most cases they are not complete implementations of a given standard, and thus may not demodulate properly when received by a standards-compliant receiver or test equipment. They are provided as a way to quickly evaluate a signal chain's analog performance in a lab environment.
Adding Carriers
Adding carriers to the vector can be accomplished multiple ways. Carriers can be added individually, or they can be added as Carrier Groups. When carriers are in a group, they can easily be frequency shifted and scaled, without adjusting each individual carrier.
Single Carriers
To add a single carrier to the vector, enter the Center Frequency and Relative Amplitude, and select the air standard, leaving the number of carriers at 1. Click Add Carriers, and the carrier will be added to the list.
Carrier Groups
If multiple carriers of the same type, with equal spacing between them, are to be added to the vector, adjust the No. of Carriers to the desired number of carriers, and adjust the Carrier Spacing. The Center Frequency in this case is the center frequency of the group of carriers.
Editing Carriers
The Center Frequency and Amplitude of a carrier or carrier group can be edited by double-clicking on the current value displayed in the list of carriers. Advanced properties for each carrier can be edited by double-clicking on the carrier type (GSM, CDMA, etc) in the carrier list.
When editing the center frequency of a Carrier Group, the center frequencies of each carrier within the group will be shifted so that the difference between the carrier's center frequency and the group's center frequency is maintained.
When editing the amplitude of the Carrier Group, the amplitude of each carrier in the group will be shifted by the same amount. The difference (in dB) between the group's amplitude and the individual carrier's amplitude will be maintained.
The individual carriers within a group can be edited in the same way that a single carrier is edited.
Carrier Order
The first carrier in the list is considered the Primary Carrier. This carrier is used to define many of the parameters of the overall vector, including the length of the data vector and the allowable sample rates. This should always be the carrier that is considered “most important.” Subsequent carriers may be automatically windowed and resampled so that they fit properly into the vector length determined by the primary carrier. When this occurs, “Windowed” and/or “Resampled” will appear in light gray just to the right of the carrier's settings (see image above).
To change the order of the carriers, select the carrier to move, and use the up and down arrow buttons on the right side of the carrier list.
Digital Backoff
When the vector is generated, the signal will be scaled such that the peak of the time-domain signal is at the full scale of the DAC (a value determined by the Resolution option). This ensures that the vector will never clip or roll over. To lower the amplitude of the vector beyond full scale, the Digital Backoff option can be used. This scaling is applied to the vector before it is sent to the DAC.
Note: Some DACs have a digital and/or analog backoff which is independent of this function. This digital backoff is applied before any backoff that the DAC may perform.
Generating the Vector
When the resulting data vector is requested, either to graph or to download to a board, it will be generated automatically. After it has been generated, the Peak to Average ratio (crest factor) will be displayed above the list of carriers. Note that changing the carriers will not update this value until the vector is generated again.
WCDMA/CDMA2k
The WCDMA and CMDA2k Carrier Properties screens provide the option to override many of the parameters used to generate a vector.

General Carrier Properties
In addition to the Center Frequency and Power Level (Amplitude) options, the Spreading Factor, Interpolation, and Windowing mode can be changed. The Chip Frequency is provided for reference only. It is fixed by the selected standard (3.84MHz for WCDMA, 1.2288MHz for CDMA2k). The Number of Symbols is also provided for reference only, as it is calculated automatically. It is recommended that the Spreading Factor, Interpolation, and Windowing not be changed for optimal performance.
Users
A WCDMA/CDMA2k carrier contains a number of user code slots. The Users section of the carrier properties allows these user codes to be configured. Up to 223 user codes can be added at once. For the most realistic peak-to-average ratio (crest factor), at least 12 users should be placed across the full 32 to 255 code range.
Adding Users
To add a new user, click the Add User button. This will create a user with a randomly selected code, and add it to the end of the user list. It can then be edited just as any existing user can.
Editing Users
To edit an existing user, click on the user in the user list. The properties on the right side of the screen will then be updated to reflect the settings of the selected user.
| Property | Description |
|---|---|
| Code | This is the code assigned to the selected user. There should not be two users with the same code. |
| Modulation | Offers a choice of different modulation techniques for this user: * QPSK - Quadrature Phase-Shift Keying * 8QAM - Quadrature Amplitude Modulation, with 8 symbols * 16QAM - Quadrature Amplitude Modulation, with 16 symbols * 32QAM - Quadrature Amplitude Modulation, with 32 symbols |
| Source | This determines what data is fed to the modulation. This is always set to Random. |
Deleting Users
To delete an existing user, select the user in the user list, and click Delete User.
GSM
The GSM Carrier Properties screens provide the option to override many of the parameters used to generate a vector.

The Power Level (Amplitude) and Center Frequency are the same as those that can be edited on the main screen. The Interpolation is computed automatically.
Modulation
The following modulations are available for a GSM carrier:
| GMSK | Original GSM modulation |
|---|---|
| 8PSK | GSM EDGE modulation |
Timeslots
Each GSM carrier contains 8 timeslots, labeled 0 through 7. For each timeslot, a Source can be specified, which determines what data is given to the modulation routine to come up with the carrier. The source is always a pseudo-random data generator. When using the random source, the Seed can be specified to ensure that the “random” data generated is consistent each run.
LTE
The LTE (Uplink/Downlink) Carrier Properties screens provide the option to adjust many of the parameters used to generate a vector.

The Power Level (Amplitude) and Center Frequency are the same as those that can be edited on the main screen. The Interpolation is computed automatically.
Transmission Bandwidth
The following bandwidths are supported, with the corresponding Resource Block (RB) count:
| 1.4MHz | 6RB |
|---|---|
| 3.0MHz | 15RB |
| 5.0MHz | 25RB |
| 10MHz | 50RB |
| 15MHz | 75RB |
| 20MHz | 100RB |
Changing the transmission bandwidth will change the vertical (y-axis) scale on the payload graph.
Cyclical Prefix
Both Normal and Extended options are supported. This affects the number of symbols per slot, with Extended having one less slot than Normal.
ACLR
This option adjusts the trade-offs between achieving better ACLR versus better EVM.
Enabled Slots
This sets the horizontal (x-axis) on the payload graph, and determines how many slots will be generated in the vector. A lower slot count will improve the time it takes to generate a vector.
Payload Graph
This graph provides a visual representation of each frame's payload. Payloads can be added by clicking and dragging within the graph. Once a payload has been added, it can be removed by right-clicking on the payload and selecting Delete from the menu. To edit a payload, right-click the payload and select Properties. From the Payload Properties window, the Source, Modulation, and Power Level can be adjusted.
Graphing Vectors
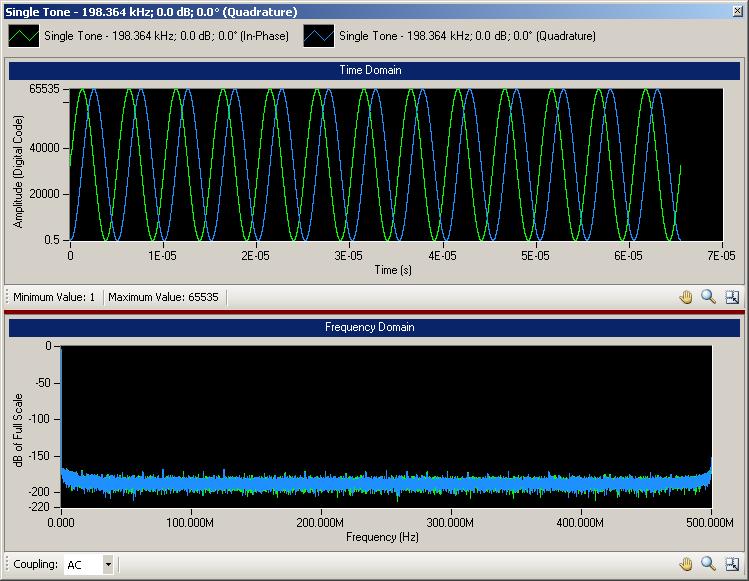
The graph display shows the selected vector(s) in both the time domain and frequency domain.
Time Domain
The time domain graph (upper) shows the digital code amplitude. The x-axes is either time, if the vector is a generated vector, or sample number, if the vector is from a data file. When graphing both a generated vector and a data file in the same window, two X axes will be displayed:

Note that even though the two vectors are drawn on top of each other, they correspond to different X axes, and thus cannot be compared directly.
The minimum and maximum value of the time domain waveform is displayed along the bottom of the graph. These values are useful in ensuring the waveform does not clip.
Frequency Domain
The frequency domain graph (lower), displays the amplitude versus frequency graph of the data. The x-axes displays the absolute frequency for generated vectors, or the relative frequency for data file vectors. The y-axes displays results in dB of Full Scale for generated vectors, and raw code values for data files.
The coupling mode can be selected by the control on the bottom of the graph. For most operations, AC is the preferred choice. For unsigned vectors, this will make no difference. For signed vectors, selecting AC will subtract the vector's average value from each individual point.
Graphing Controls
 | Pan: Click and Drag to move the graph window |
 | Zoom: Drag a box to select the region to zoom in to |
 | Reset: Reverts the pan and zoom settings to their original values |
The range of the axes can also be changed by clicking on the first or last value in the range.
resources/tools-software/ace/dpg-lite.1625052510.txt.gz · Last modified: 30 Jun 2021 13:28 by Ciaran Watterson