


No renderer 'pdf' found for mode 'pdf'
This version (09 Jan 2021 00:42) was approved by Robin Getz.The Previously approved version (09 Oct 2013 03:06) is available.
Table of Contents
ADIS16334 EVALUATION ON THE EVAL-ADIS
OVERVIEW
The ADIS16334 is a low-profile, high-performance IMU that uses a serial peripheral interface for data communications. This interface enables direct connection with a large variety of embedded processor products. This electrical connection typically only requires 5 I/O lines for synchronous data collection, as show in the following figure:

ADIS16334/PCB BREAKOUT BOARD
For those who are on a tight timeline, connecting the ADIS16334 to an embedded controller will provide the most flexibility in developing application firmware and will more closely reflect the final system design. The ADIS16334/PCBZ is the breakout board for the ADIS16334 and may provide assistance in the process of hooking it up to an existing embedded processor system. For more information on the ADIS16334/PCBZ breakout boards, check out the following link: ADIS16334/PCB Breakout Board Web Page.
EVAL-ADIS: PC EVALUATION
For those who would prefer to perform PC-based evaluation of the ADIS16334, before developing their own embedded system, the EVAL-ADIS is the appropriate system to use. The remainder of this Wiki site will focus on PC-based evaluation with the EVAL-ADIS system.
EQUIPMENT LIST
SYSTEM REQUIREMENTS
Windows XP, Vista, 7
.NET Framework 3.5
NOTE: Newer versions of the .NET framework do not currently support the IMU Evaluation software package.
PHYSICAL SETUP
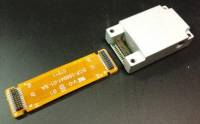
The ADIS16334/PCBZ includes one interface PCB, one flexible cable/connector and one ADIS16334AMLZ unit. Use the flexible cable/connector to install the ADIS16334 onto the EVAL-ADIS, using the following five steps. Set interface PCB aside, as it is not used for connecting the ADIS16334AMLZ to the EVAL-ADIS.
NOTE: Do not plug the EVAL-ADIS into the USB cable at this stage of the setup. Wait until the software installation is complete.
NOTE: Most of the pictures in this section represent the ADIS16448, not the ADIS16334. The packages associated with these two products are close enough to illustrate the key points associated with installing the ADIS16334.
Step #1
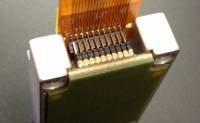
Install the flexible cable onto the ADIS16334AMLZ. The following pictures provide a visual reference for correct connection.


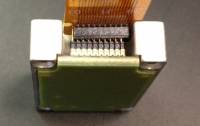
WARNING: Make sure that the connector is in proper alignment before pressing it in. Misalignment can cause pin damage and exposure to harmful conditions. The following pictures provide visual examples of INCORRECT PIN ALIGNMENT. The most common alignment issues will cause the top view to look different than the third picture, shown directly above this paragraph.
Step #2
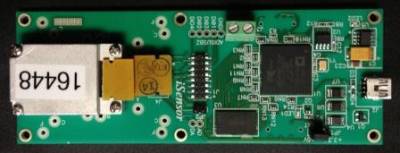
Connect the other end of the flexible cable to the EVAL-ADIS, using J4, pins 1-20. J4 has 24 pins, so make sure that the flexible cable connects only to pins 1-20 on J4.


Step #3
Slide the ADIS16334AMLZ body towards J4, while tucking the excess flexing under the connector interface, as show in the following pictures.


Step #4
Secure the ADIS16334AMLZ body, using (4) M2x0.4x10mm machine screws (included with EVAL-ADIS) and the “D” mounting holes (EVAL-ADIS labels for mounting holes).

Step #5
Set the jumper JP1 on the (EVAL-ADIS) to the +5V position setting for the ADIS16334AMLZ. The following picture shows JP1 in the +3.3V position
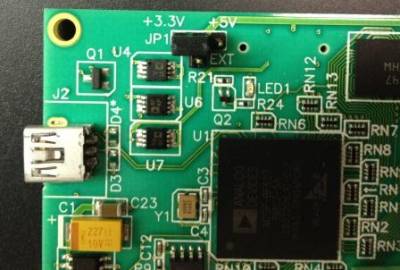
NOTE: If JP1 is left on +3.3V, the gyroscope outputs will not respond and will appear to be saturated in one direction or the other. See the following picture for an example of this behavior.

IMU EVALUATION SOFTWARE OVERVIEW
The EVAL-ADIS2 has been superseded by the EVAL-ADIS-FX3 and is no longer supported.
This guide assumes that you've connected your vibration sensor to the EVAL-ADIS2, drivers were successfully installed on your PC, and you've downloaded the correct software for your sensor. We recommend reviewing the Hardware User Guide before continuing.
Software Downloads
Click here to download the latest version of the IMU Evaluation software.
Click here to download the latest drivers for the EVAL-ADIS2.
This application requires Microsoft .NET 3.5 to be installed and enabled on the host PCs running Windows 10. Additional information on enabling .NET 3.5 can be found here.
EVAL-ADIS2 IMU Evaluation Software Overview
The IMU Evaluation Software is a Microsoft Windows (.NET) application that works in conjunction with the EVAL-ADIS2, in order to provide users with a PC-Based interface to most ADIS16xxx products. This platform enables observation of basic sensor functions, read/write access to all user-accessible registers, and full-rate data acquisition, which is synchronous with data production of each ADIS16xxx.

This guide builds upon the EVAL-ADIS2 Hardware User Guide and assumes that you've installed the necessary drivers and software.
Using the EVAL-ADIS2 IMU Evaluation Software
Main Window
Once the IMU Evaluation software loads, you should be presented with a window similar to the image shown below.

The image below has been color-coded to illustrate the different parts of the IMU Evaluation Software. These colored sections will be referred to in the following sections.
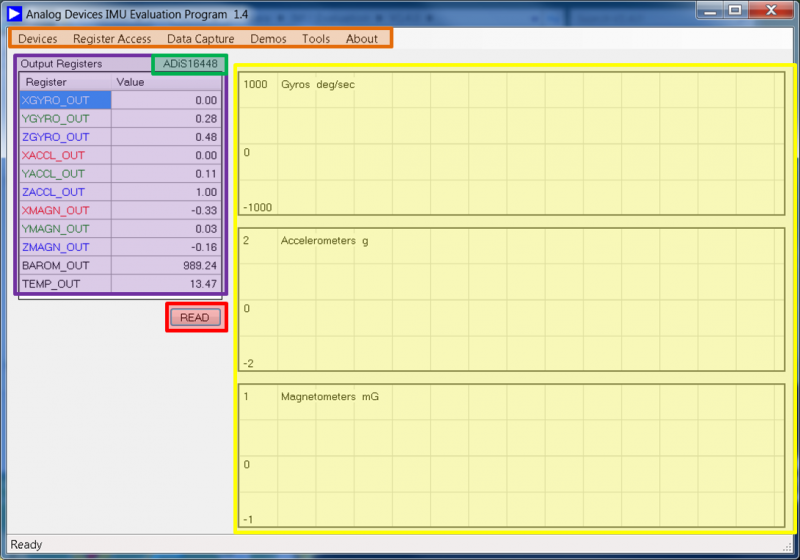
The drop-down menus highlighted in orange list additional features and utilities that make up the core functionality of the evaluation software.
- The Devices menu provides a list of supported products. Selecting a product from this list will configure the IMU evaluation software register map. Each device has a unique register map that must be selected to ensure proper sensor operation. The green box shows the active device. In this example, the ADIS16448 is selected.
- The Register Access option calls a sub-menu that lists all user-configurable registers available from the part number selected in the “Devices” drop-down menu. It also provides read/write access to each register.
- The Data Capture option calls a sub-menu designed to enable synchronous data logging from the selected device.
- The Demos option calls a 3-D visualization tool. This feature is only supported for the ADIS16480 and ADIS16448 devices.
- The Tools option calls a sub-menu that displays USB diagnostic information.
- The About option provides more detailed software revision information.
The purple box shows the primary, inertial output registers for the selected device. These values are updated in real-time after pressing the Read button (identified by a red box).
The yellow box shows three waveform recorder windows. Each window allows for plotting the three primary sensor types (gyroscopes, accelerometers, and magnetometers [if supported]). The top subplot displays gyroscope data, the middle plot displays accelerometer data and the bottom plot displays magnetometer data. Each plot color corresponds to the colors displayed in the “Output Registers” window (highlighted in purple).
Register Access
The Register Access window provides read and write access to all user-accessible registers listed in the selected device's datasheet. The image below shows a screenshot of the window.

The color-coded image below is referenced in the following section.

The purple box sorts each set of registers into a standard category. The available categories are:
- Control/Status - General sensor configuration, alarm, and metadata registers
- Output - Inertial sensor output registers
- Calibration - User offset and misc. calibration registers
The calibration register section mentioned above is separate from the factory calibration registers and procedures!
The section highlighted by the red box lists all of the registers in the selected category. Click on the register name to select a register for individual read/write access.
The green box identifies the read/write control options for the current register selection.
Registers must be written in hexadecimal format!
The Update Registers in Category button (shown in an orange box above) automatically reads all of the registers shown in the selected category (red box) and updates their contents in the GUI.
The section highlighted in yellow identifies provides a means of easily calling subroutines within the connected sensor. Clicking on a button is equivalent to writing a single-bit command to the respective register.
The Save Reg Settings to File programmatically reads and saves the contents of all of the registers in the current category into a *.csv (common-delimited) file. The Load Reg Settings from File button reads a target .csv file and attempts to write the saved values back into the sensor.
The Register Access form always writes to both the upper and lower bytes of a given register. When writing to a register, make sure to include the desired 16-bit value in hexadecimal format before clicking the Write Register button.
Data Capture
The Data Capture window only supports synchronous data acquisition and logging to a file on the host PC. Data samples are only read from the sensor when the data ready pin toggles, indicating that data is valid.

The color-coded image below is referenced in the following section.

The section highlighted in red lists all of the registers that are eligible for data capture. Checking the box next to each register indicates that the specified register values should be recorded once the data stream begins.
The section highlighted in green allows for customizing the file name and location of the resultant .csv files.
The section highlighted in yellow identifies the data stream configuration options.
- Record Length - The total number of samples to be captured. A sample is defined as a single “data valid” period as signaled by the data ready pin on the sensor
- Sample Rate - The instantaneous data ready rate as measured by the evaluation board
- Capture Time - The estimated data capture time in DD:HH:MM:SS format calculated based upon the instantaneous sample rate
- Add File Header - Selects whether a header displaying the contents of each column should be appended to the beginning of the .csv file
- Use Scaled Data - Signals to the software to convert the 16-bit values read from the sensor into a sign-adjusted (two's complement) scaled number. For example, when this option is enabled, be in units of degrees/second
Software Revision History
USB Driver Installation
The EVAL-ADIS2 has been superseded by the EVAL-ADIS-FX3 and is no longer supported.
This guide assumes that you've connected your vibration sensor to the EVAL-ADIS2, drivers were successfully installed on your PC, and you've downloaded the correct software for your sensor. We recommend reviewing the Hardware User Guide before continuing.
Software Downloads
Click here to download the latest version of the IMU Evaluation software.
Click here to download the latest drivers for the EVAL-ADIS2.
This application requires Microsoft .NET 3.5 to be installed and enabled on the host PCs running Windows 10. Additional information on enabling .NET 3.5 can be found here.
EVAL-ADIS2 IMU Evaluation Software Overview
The IMU Evaluation Software is a Microsoft Windows (.NET) application that works in conjunction with the EVAL-ADIS2, in order to provide users with a PC-Based interface to most ADIS16xxx products. This platform enables observation of basic sensor functions, read/write access to all user-accessible registers, and full-rate data acquisition, which is synchronous with data production of each ADIS16xxx.
This guide builds upon the EVAL-ADIS2 Hardware User Guide and assumes that you've installed the necessary drivers and software.
Using the EVAL-ADIS2 IMU Evaluation Software
Main Window
Once the IMU Evaluation software loads, you should be presented with a window similar to the image shown below.
The image below has been color-coded to illustrate the different parts of the IMU Evaluation Software. These colored sections will be referred to in the following sections.
The drop-down menus highlighted in orange list additional features and utilities that make up the core functionality of the evaluation software.
- The Devices menu provides a list of supported products. Selecting a product from this list will configure the IMU evaluation software register map. Each device has a unique register map that must be selected to ensure proper sensor operation. The green box shows the active device. In this example, the ADIS16448 is selected.
- The Register Access option calls a sub-menu that lists all user-configurable registers available from the part number selected in the “Devices” drop-down menu. It also provides read/write access to each register.
- The Data Capture option calls a sub-menu designed to enable synchronous data logging from the selected device.
- The Demos option calls a 3-D visualization tool. This feature is only supported for the ADIS16480 and ADIS16448 devices.
- The Tools option calls a sub-menu that displays USB diagnostic information.
- The About option provides more detailed software revision information.
The purple box shows the primary, inertial output registers for the selected device. These values are updated in real-time after pressing the Read button (identified by a red box).
The yellow box shows three waveform recorder windows. Each window allows for plotting the three primary sensor types (gyroscopes, accelerometers, and magnetometers [if supported]). The top subplot displays gyroscope data, the middle plot displays accelerometer data and the bottom plot displays magnetometer data. Each plot color corresponds to the colors displayed in the “Output Registers” window (highlighted in purple).
Register Access
The Register Access window provides read and write access to all user-accessible registers listed in the selected device's datasheet. The image below shows a screenshot of the window.
The color-coded image below is referenced in the following section.
The purple box sorts each set of registers into a standard category. The available categories are:
- Control/Status - General sensor configuration, alarm, and metadata registers
- Output - Inertial sensor output registers
- Calibration - User offset and misc. calibration registers
The calibration register section mentioned above is separate from the factory calibration registers and procedures!
The section highlighted by the red box lists all of the registers in the selected category. Click on the register name to select a register for individual read/write access.
The green box identifies the read/write control options for the current register selection.
Registers must be written in hexadecimal format!
The Update Registers in Category button (shown in an orange box above) automatically reads all of the registers shown in the selected category (red box) and updates their contents in the GUI.
The section highlighted in yellow identifies provides a means of easily calling subroutines within the connected sensor. Clicking on a button is equivalent to writing a single-bit command to the respective register.
The Save Reg Settings to File programmatically reads and saves the contents of all of the registers in the current category into a *.csv (common-delimited) file. The Load Reg Settings from File button reads a target .csv file and attempts to write the saved values back into the sensor.
The Register Access form always writes to both the upper and lower bytes of a given register. When writing to a register, make sure to include the desired 16-bit value in hexadecimal format before clicking the Write Register button.
Data Capture
The Data Capture window only supports synchronous data acquisition and logging to a file on the host PC. Data samples are only read from the sensor when the data ready pin toggles, indicating that data is valid.
The color-coded image below is referenced in the following section.
The section highlighted in red lists all of the registers that are eligible for data capture. Checking the box next to each register indicates that the specified register values should be recorded once the data stream begins.
The section highlighted in green allows for customizing the file name and location of the resultant .csv files.
The section highlighted in yellow identifies the data stream configuration options.
- Record Length - The total number of samples to be captured. A sample is defined as a single “data valid” period as signaled by the data ready pin on the sensor
- Sample Rate - The instantaneous data ready rate as measured by the evaluation board
- Capture Time - The estimated data capture time in DD:HH:MM:SS format calculated based upon the instantaneous sample rate
- Add File Header - Selects whether a header displaying the contents of each column should be appended to the beginning of the .csv file
- Use Scaled Data - Signals to the software to convert the 16-bit values read from the sensor into a sign-adjusted (two's complement) scaled number. For example, when this option is enabled, be in units of degrees/second
Software Revision History
IMU EVALUATION SOFTWARE GETTING STARTED
The EVAL-ADIS2 has been superseded by the EVAL-ADIS-FX3 and is no longer supported.
This guide assumes that you've connected your vibration sensor to the EVAL-ADIS2, drivers were successfully installed on your PC, and you've downloaded the correct software for your sensor. We recommend reviewing the Hardware User Guide before continuing.
Software Downloads
Click here to download the latest version of the IMU Evaluation software.
Click here to download the latest drivers for the EVAL-ADIS2.
This application requires Microsoft .NET 3.5 to be installed and enabled on the host PCs running Windows 10. Additional information on enabling .NET 3.5 can be found here.
EVAL-ADIS2 IMU Evaluation Software Overview
The IMU Evaluation Software is a Microsoft Windows (.NET) application that works in conjunction with the EVAL-ADIS2, in order to provide users with a PC-Based interface to most ADIS16xxx products. This platform enables observation of basic sensor functions, read/write access to all user-accessible registers, and full-rate data acquisition, which is synchronous with data production of each ADIS16xxx.
This guide builds upon the EVAL-ADIS2 Hardware User Guide and assumes that you've installed the necessary drivers and software.
Using the EVAL-ADIS2 IMU Evaluation Software
Main Window
Once the IMU Evaluation software loads, you should be presented with a window similar to the image shown below.
The image below has been color-coded to illustrate the different parts of the IMU Evaluation Software. These colored sections will be referred to in the following sections.
The drop-down menus highlighted in orange list additional features and utilities that make up the core functionality of the evaluation software.
- The Devices menu provides a list of supported products. Selecting a product from this list will configure the IMU evaluation software register map. Each device has a unique register map that must be selected to ensure proper sensor operation. The green box shows the active device. In this example, the ADIS16448 is selected.
- The Register Access option calls a sub-menu that lists all user-configurable registers available from the part number selected in the “Devices” drop-down menu. It also provides read/write access to each register.
- The Data Capture option calls a sub-menu designed to enable synchronous data logging from the selected device.
- The Demos option calls a 3-D visualization tool. This feature is only supported for the ADIS16480 and ADIS16448 devices.
- The Tools option calls a sub-menu that displays USB diagnostic information.
- The About option provides more detailed software revision information.
The purple box shows the primary, inertial output registers for the selected device. These values are updated in real-time after pressing the Read button (identified by a red box).
The yellow box shows three waveform recorder windows. Each window allows for plotting the three primary sensor types (gyroscopes, accelerometers, and magnetometers [if supported]). The top subplot displays gyroscope data, the middle plot displays accelerometer data and the bottom plot displays magnetometer data. Each plot color corresponds to the colors displayed in the “Output Registers” window (highlighted in purple).
Register Access
The Register Access window provides read and write access to all user-accessible registers listed in the selected device's datasheet. The image below shows a screenshot of the window.
The color-coded image below is referenced in the following section.
The purple box sorts each set of registers into a standard category. The available categories are:
- Control/Status - General sensor configuration, alarm, and metadata registers
- Output - Inertial sensor output registers
- Calibration - User offset and misc. calibration registers
The calibration register section mentioned above is separate from the factory calibration registers and procedures!
The section highlighted by the red box lists all of the registers in the selected category. Click on the register name to select a register for individual read/write access.
The green box identifies the read/write control options for the current register selection.
Registers must be written in hexadecimal format!
The Update Registers in Category button (shown in an orange box above) automatically reads all of the registers shown in the selected category (red box) and updates their contents in the GUI.
The section highlighted in yellow identifies provides a means of easily calling subroutines within the connected sensor. Clicking on a button is equivalent to writing a single-bit command to the respective register.
The Save Reg Settings to File programmatically reads and saves the contents of all of the registers in the current category into a *.csv (common-delimited) file. The Load Reg Settings from File button reads a target .csv file and attempts to write the saved values back into the sensor.
The Register Access form always writes to both the upper and lower bytes of a given register. When writing to a register, make sure to include the desired 16-bit value in hexadecimal format before clicking the Write Register button.
Data Capture
The Data Capture window only supports synchronous data acquisition and logging to a file on the host PC. Data samples are only read from the sensor when the data ready pin toggles, indicating that data is valid.
The color-coded image below is referenced in the following section.
The section highlighted in red lists all of the registers that are eligible for data capture. Checking the box next to each register indicates that the specified register values should be recorded once the data stream begins.
The section highlighted in green allows for customizing the file name and location of the resultant .csv files.
The section highlighted in yellow identifies the data stream configuration options.
- Record Length - The total number of samples to be captured. A sample is defined as a single “data valid” period as signaled by the data ready pin on the sensor
- Sample Rate - The instantaneous data ready rate as measured by the evaluation board
- Capture Time - The estimated data capture time in DD:HH:MM:SS format calculated based upon the instantaneous sample rate
- Add File Header - Selects whether a header displaying the contents of each column should be appended to the beginning of the .csv file
- Use Scaled Data - Signals to the software to convert the 16-bit values read from the sensor into a sign-adjusted (two's complement) scaled number. For example, when this option is enabled, be in units of degrees/second
Software Revision History
IMU EVALUATION SOFTWARE REVISION HISTORY
EXAMPLE EXERCISES
This section currently has no ADIS16334-specific content, but the ADIS16448 Evaluation on the EVAL-ADIS Wiki Site has some good examples to start with.
resources/eval/user-guides/inertial-mems/imu/adis16334.txt · Last modified: 09 Jan 2021 00:39 by Robin Getz