


This version (01 Mar 2018 03:25) was approved by Jeff Watson.The Previously approved version (20 Feb 2018 09:24) is available.
Table of Contents
EV-HT-200CDAQ1 User's Guide
Introduction
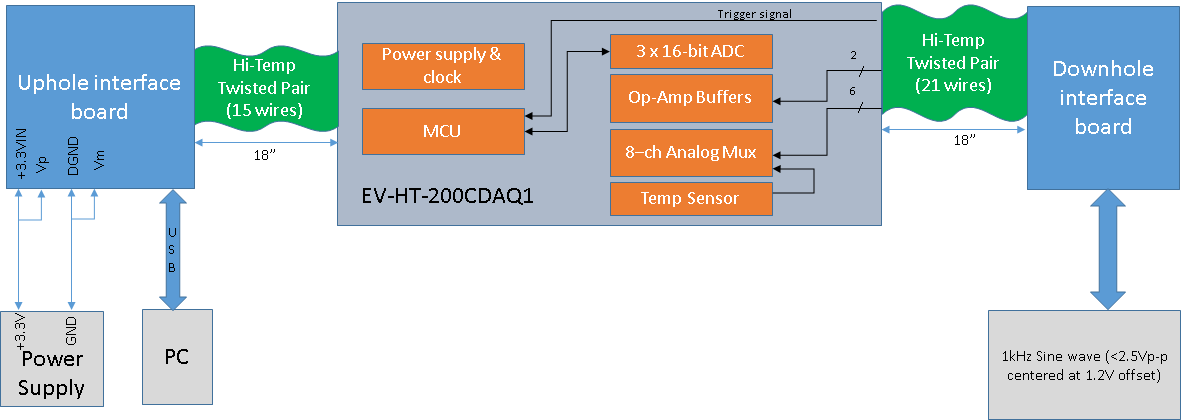
The EV-HT-200CDAQ1 reference design kit includes a high temperature circuit assembly with data acquisition front-end and microcontroller, optimized firmware, data capture and analysis software, source code, design files, bill of materials, test reports, and breakout boards. This platform is suitable for reference design, rapid prototyping and lab testing of high temperature instrumentation systems. The dimensions and construction of the circuit assembly have been designed to be compatible with oil and gas instrumentation form factors, although it can also be used as the basis for other high temperature applications. A block diagram of the main board is shown below. For a detailed overview of the platform features, see the overview wiki page.

Purpose
This document is intended to provide instructions on how to connect and use the main features of the evaluation board. For more detailed information on the software features, organization, hardware design notes and other useful information refer to the main wiki page.
Kit Contents
- HT-DAB-1 reference board – Programmed with demonstration firmware
- Power/Comm Breakout (Uphole) board + 18” high temperature twisted pair cable (15 wire)
- Analog Input Breakout (Downhole) board + 18” high temperature twisted pair cable (21 wire)
- JTAG connection interface board
- 1/16th inch Allen Wrench
- USB cable
Overview of Hardware Components
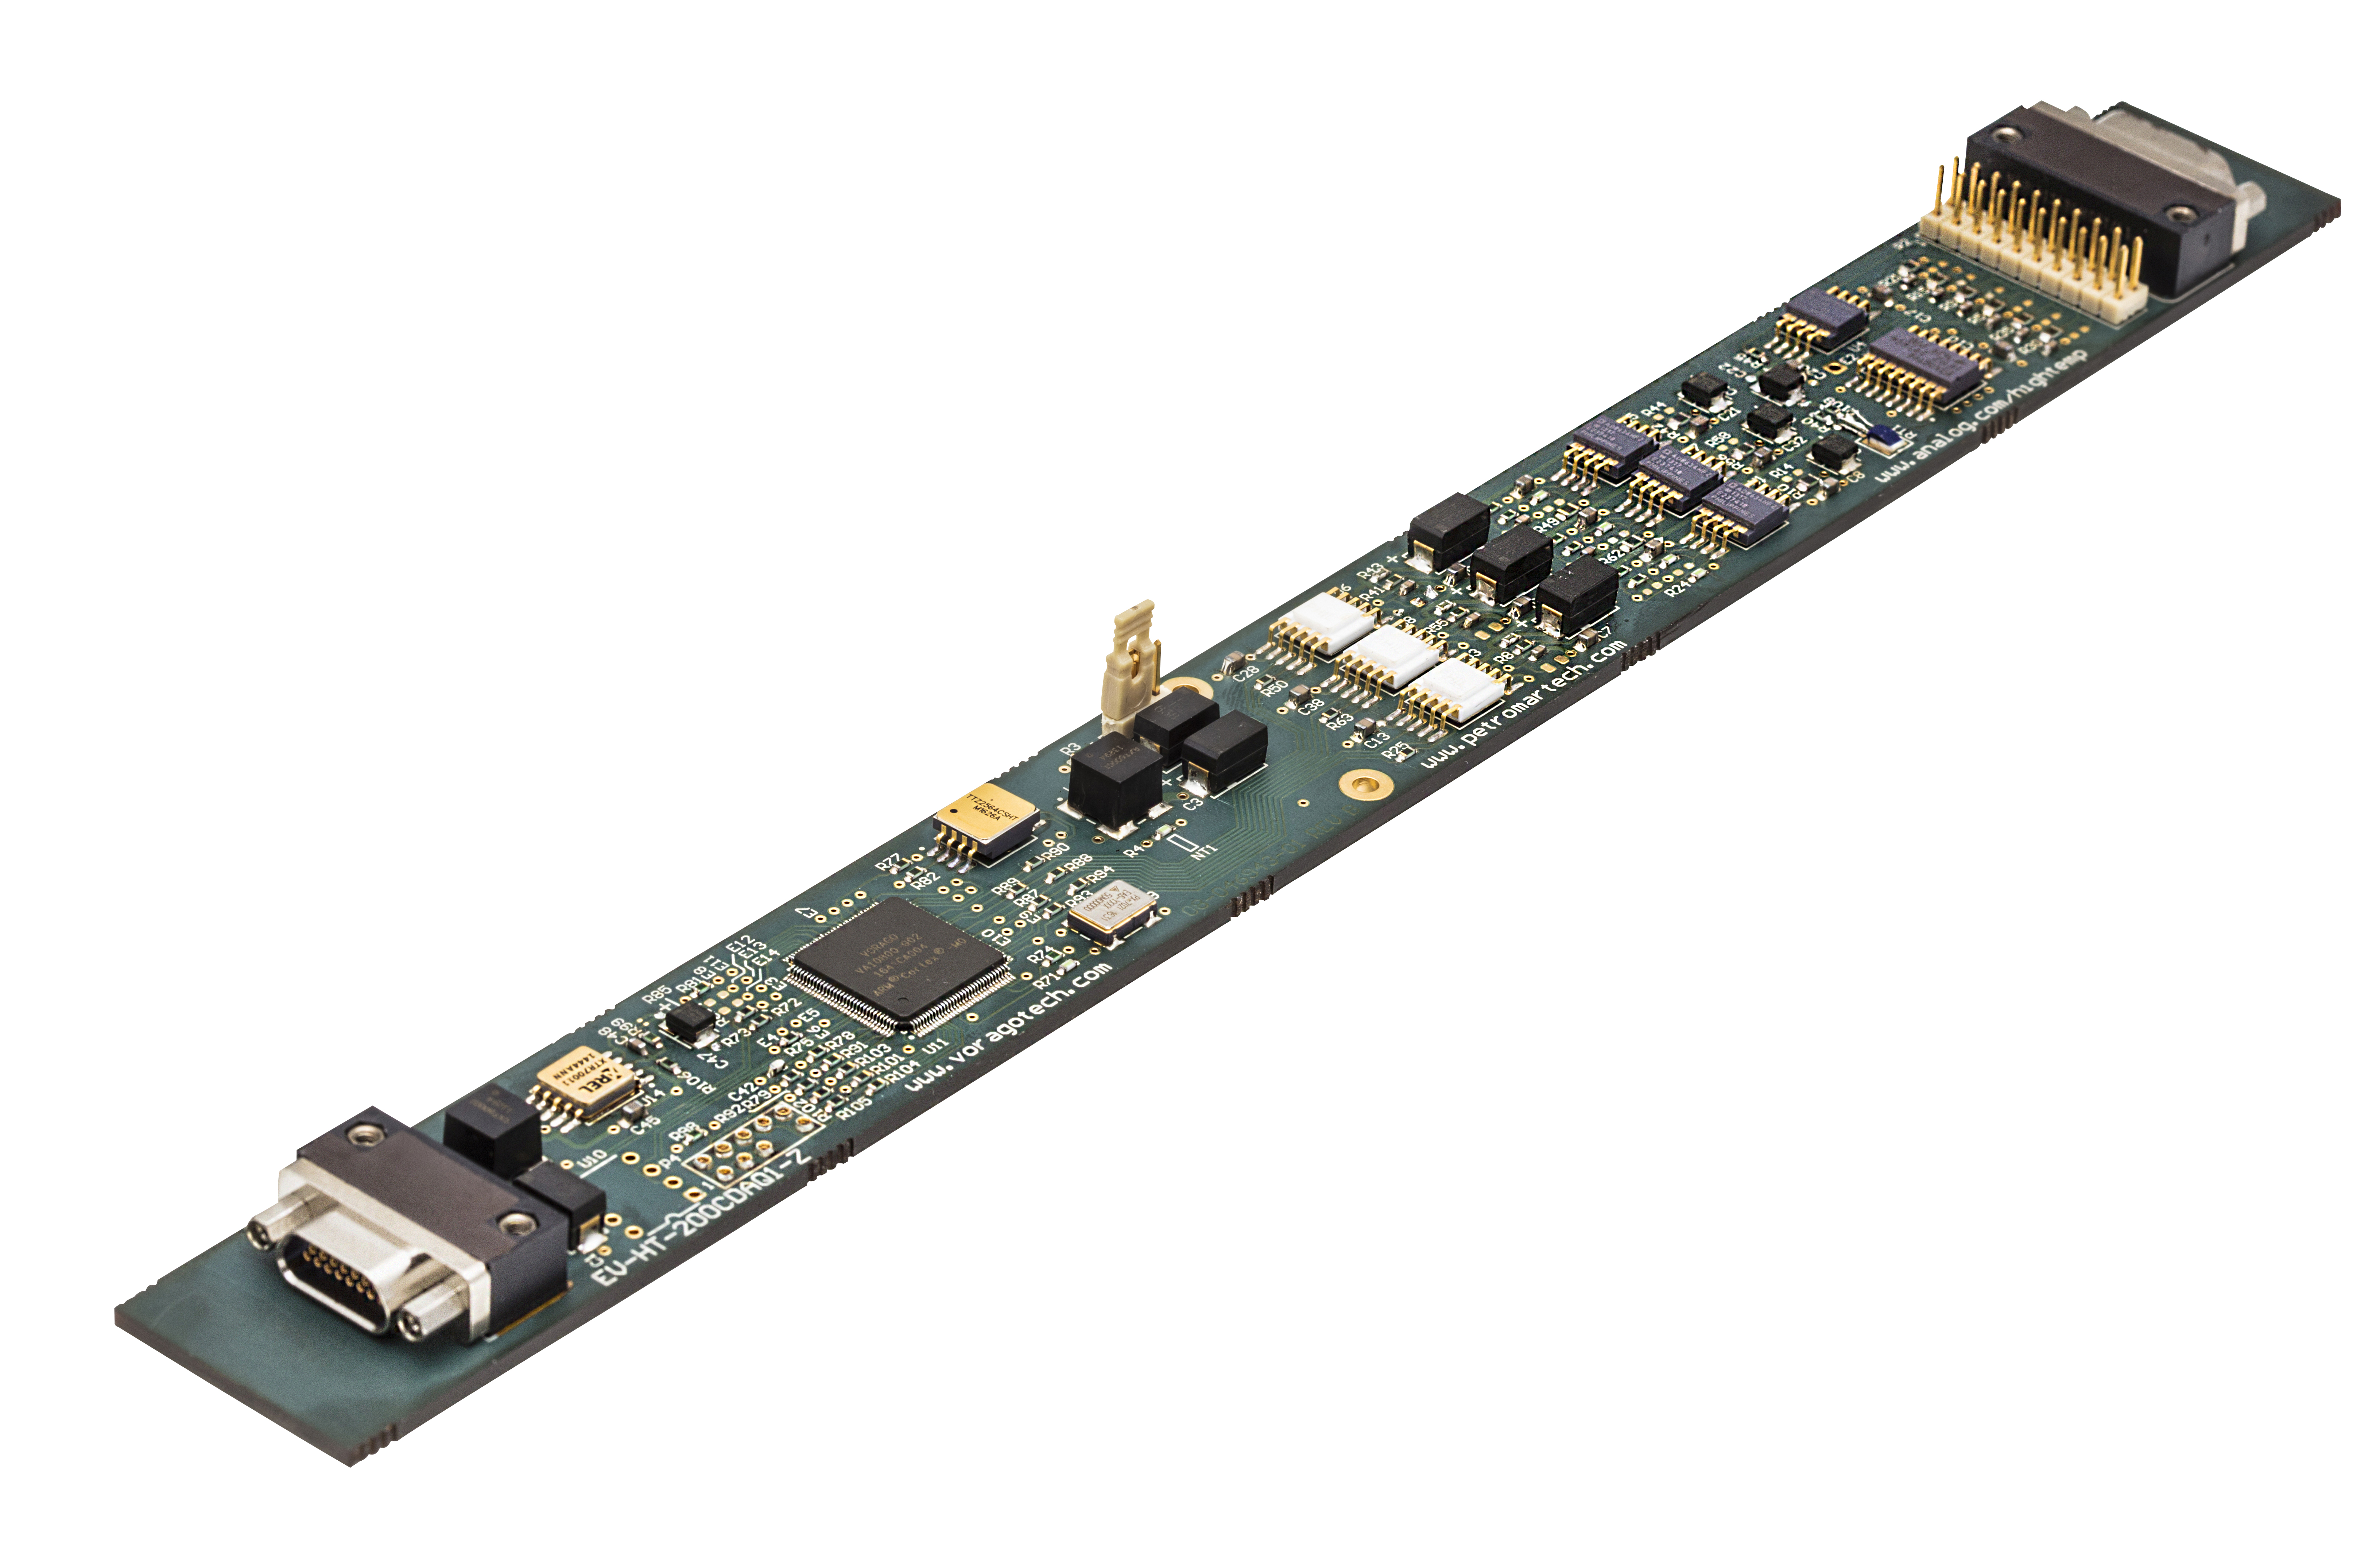
The main EV-HT-200CDAQ1 reference design board is pictured below:
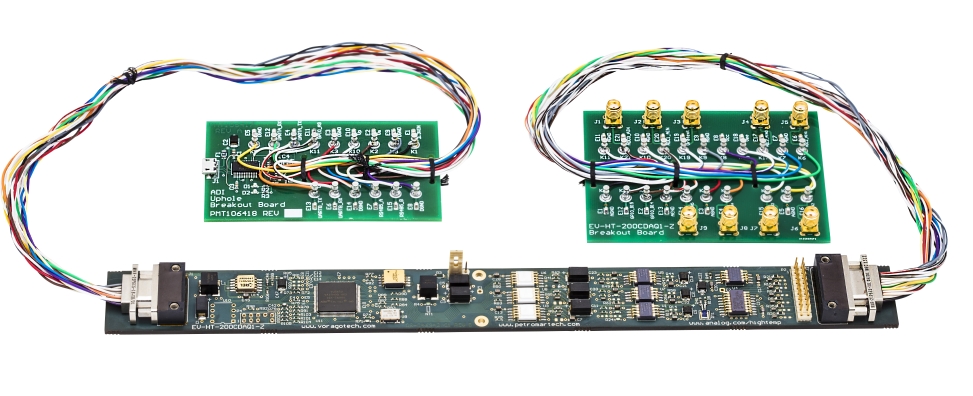
In addition to this main board, the following supporting boards are included in the kit:
- Power/Comm Breakout board which has “Uphole” connections including power supplies and USB connection for communication to the main board

- Analog Input Breakout board with “Downhole” connections to analog sensors and analog circuit specific power
supplies.

- A JTAG interface for programming the board or debugging firmware. (A separate JTAG probe is required which are available from Segger, IAR, ARM or iSystem).

Only the main EV-HT-200CDAQ1 board and the wiring harness of the harnesses of the breakout boards are rated for high temperature exposure. Do not place these accessory boards in the high temperature test environment
Overview of Software Components
There are two main software components incorporated in this project the VA10800 ARM microcontroller firmware, and the Data Viewer host software.
All EV-HT-200CDAQ1 boards come with the microcontroller pre-programmed. The latest firmware can be downloaded and built by downloading it from ADI's GitHub. See the software download wiki page for further details. The firmware is programmed with multiple, highly configurable modes of data acquisition. Acquired data is sent to a PC via the UART interface.
The Data Viewer host software (and open source) can be downloaded from the software download wiki page. This software communicates with the main board via UART to control acquisition modes, display data, log data and run signal analysis.
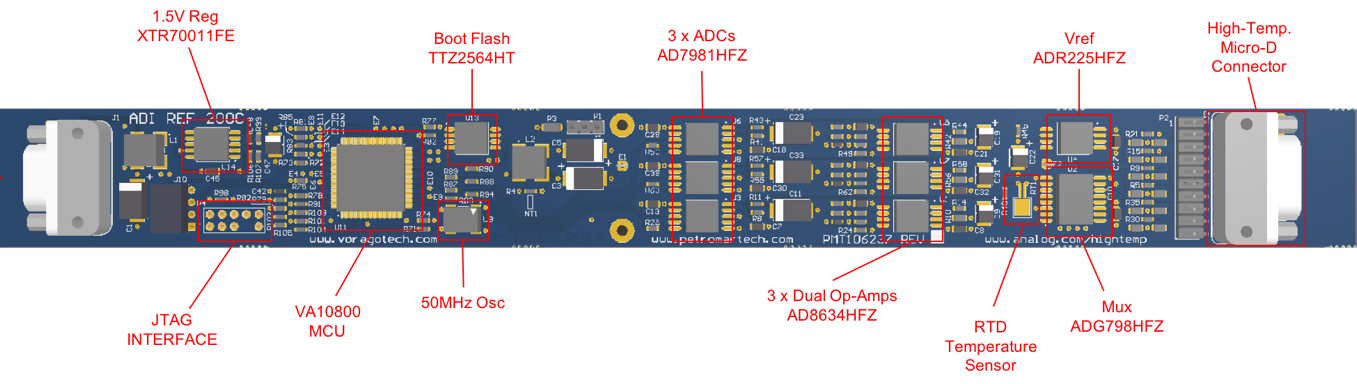
Component Placement Guide
The image below is a quick reference for main component placement on the main board. Consult the schematic in the design package for more detailed information.
Connector Pin Assignment Table
To assist with quickly finding which pins are tied to the various connectors on the board, the following set of tables are provided. Refer to the schematic for IC connection details.

Hardware Setup and Check
Prior to running the HT DAQ viewer software and measuring precision signals, it is recommended that the communication channels be checked ste-by-step using the minimum connection as described in the steps below. Refer to the diagram below for guidance on connections. PuTTY, free terminal software, is used in this hardware check. If you do not have this program installed, you can download it at http://www.putty.org.
- Connect the uphole interface board with 15-wire cable assembly to the EV-HT-200CDAQ1 board connector J1 using the included allen wrench. <note important>It is best to alternate sides as the connectors are screwed together in order to apply even pressure across the rows of pins</note>
- Connect the downhole interface board with 21-wire cable assembly to the EV-HT-200CDAQ1 board connector J2 using the included allen wrench.
- On the powers/comms breakout board, connect a 3.3V power supply to two connections on the uphole interface board: “3.3VIN” and “Vp”. Vp provides power to the analog portion of the board. Make a ground connection to the K9 turret, “DGND” and the K2 turret, “Vm”. Apply 3.3V. If you are able to monitor current through the supply, it should be around 45 mA.
- Connect the USB cable between PC and the HT-DAB-1 uphole interface board. The PC should enumerate with the FTDI chip. If it does not, please go to the FTDI website (http://www.ftdichip.com/FTDrivers.htm) and download the Windows drivers for FT232R.
- Start a PuTTY terminal window,select baud rate = 2000000 (6 zeros) with handshaking = CTS/RTS. Choose the Communication Port. (To determine the COM port, start the Windows Device Manager and select “Ports (COM & LPT)”. If the USB interface on the Uphole board has enumerated, it will show up as a serial port.)
- Enter “$version” on the terminal window. If the MCU is powered, it will respond with firmware and MCU identification information. If no response is made when key strokes are entered, please double check the hardware and the COM port number.
- Enter “$gettemp” on the terminal window. If the analog portion is powered and working properly, you should get a message back with accurate temperature and VCC voltage measurement information. If the temperature or voltage do not make sense, the most likely cause is not having the analog supply provided.
- Enter “$setacq 40 255 80 255 5”. This will set the experiment to 255 samples of ch0 (4 microsecond conversion period.) and ch2 (8 microsecond conversion period).
- Enter “$single”. The terminal window should display sampling data for ch0 and ch2 with hexadecimal characters.
Connecting Vp to 3.3V and Vm to GND is the simplest connection, but does not give the highest performance signal acquisition. To achieve maximum performance from the analog front end, separate bipolar connections should be used with Vp=+5VDC and Vm=-2.5VDC. See the wiki section on hardware design notes for further information
Installing and Using HT DAQ Viewer
HT DAQ Viewer is a Windows application that allows the user to connect, control, view and log captured data from the EV-HT-200CDAQ1 reference design board. It has advanced signal analysis functions built in including FFT, histogram, and spectrum analysis to facilitate deep data examination. Source code for HT DAQ Viewer in C# is available on the ADI GitHub, see the software download wiki page for more information.
System Requirements
- PC running Windows 7 or 10
- One free USB port
- EV-HT-200CDAQ1 board connected and powered as described in section above
Installing the Application
HT DAQ Viewer is a “zero install” executable. Download the latest version of the software from the software download wiki page. Unzip the archive in a directory of your choice. Click on the “HT DAQ Viewer.exe” to run the program. If you want to have a shortcut on your desktop or another folder, right click on the “HT DAQ Viewer.exe” and select “create shortcut” and place this link where desired.
Connecting to the Board
The board should be properly connected, and powered-ON as described in the previous section. Connect the USB cable included in the kit from the PC to the Power/Comm breakout board. The breakout board will instantiate as a COM port in the Windows Device Manager as shown in the below diagram. Note the port number.

Start the application, enter the COM port number then click the “Connect” button.

Upon connection, the board firmware information will be displayed in the “About” tab dialog. This is the easiest way to show the kit is powered up and communicating with the PC.

Data Capture Modes
Data is captured by the EV-HT-200CDAQ1 firmware in two different modes, Burst Mode or Continuous Mode.
In Burst Mode, the firmware allows for a high sample rate (minimum = 2.4 microseconds) capture for short intervals. Specific channels and rates are manually set. In Continuous Mode, all channels are sampled sequentially at a fixed sample period of approximately 10 microseconds, as shown in below diagram. A full sequence is conducted at a periodic rate set by the user. In both modes, data is transmitted over the UART interface to the HT DAQ Viewer for both display and analysis.

Capturing Data in Burst Mode
In Burst Mode, the firmware will:
- Acquire 8k samples data from the selected ADC channels.
- Store the sample data (16 bits each) in an 16Kbyte buffer.
- Transmit the buffer to the HT DAQ Viewer.
This process is done on either a ‘single shot’ or ‘periodic’ basis as specified by the user. Any combination of channels can be selected. The 16Kbyte buffer will be equally shared among selected channels as shown in the below table.

Channels 0 and 1 capture data simultaneously on ADC units 0 and 1. Channels 2 to 9 are multiplexed and will capture data sequentially on ADC unit 2. The multiplexor and associated buffer require additional time for the signal to settle before it can be accurately converted. When using more than one multiplex channel, keep the sample rate above 4 microseconds. If only one mux channel is selected, then there is no multiplexor switching action performed during the burst acquisition on ADC unit 2 and the minimum sample period is 2.4 microseconds. ADC’s 0 and 1 samples are acquired first followed by ADC2. At the end of each burst mode experiment channels 8 and 9 are sampled 4 times and averaged for a VCC and RTD reading. ADC’s 0 and 1 are then acquired for the full burst period followed by ADC2. An example timeline for a burst mode experiment with multiple channels selected is shown below.


To execute a burst mode acquisition, set up the channel and period parameters then click the “Start Acquisition” or “Single Shot” button. The following screen captures are for an example acquiring a 1 kHz sine waveform on CH0 at 400ksps for 8192 samples and repeating this every 2 seconds.

AC Analysis and Histogram
An AC Analysis and Histogram is automatically performed when only a single channel is selected and “burst mode” is run. The figure below shows the results for a 1 kHz sine wave.

AC Analysis Snapshot
While on the FFT Tab, you can use the Windows Copy (CTRL-C) to save a snapshot of the AC analysis data into the Windows Clipboard. This data can then be Pasted (CTRL-P) from the Windows Clipboard to an Excel spreadsheet or as text in a text editor like Notepad. Shown is an example of 7 Copy and Paste actions into Excel from the AC analysis window.

Histogram
A histogram example from a 1 kHz sine wave is shown here.

Capturing Data in Continuous Mode
Continuous mode will sequentially sample all channels (0 to 9) at the sample period set in the “Sample Period” window. It is enabled by checking the Enabled checkbox in the Continuous mode dialog box. The samples will commence when the “Start Acquisition” box is clicked. The data is sent continuously to the HT DAQ Viewer application for live display. All ten channels are acquired, but only eight graphs are displayed as CH8 (VCC) and CH9 (RTD) are displayed on the left pane as Board Temperature and VCC.

External Trigger Mode
It is possible to conduct sampling when an external trigger signal is applied. The channel setup is the same but the experiment period must be set to 0 and an external signal applied to GPIOB14 on the analog breakout board. When the trigger goes active, the selected ADC channels will be sampled. The delay from the signal going active (high) before the first sample occurs will be under 20 microseconds.
Data Export to CSV
The data captured from a single experiment can be exported to a CSV (comma separated variable) file by clicking the “Export to CSV” button. Data format is as shown in italics below. The first five lines contain experiment information. The subsequent lines (>8k) have the conversion information in floating point format with a trailing comma on each line.
resources/eval/user-guides/high-temp/ev-ht-200cdaq1/usersguide.txt · Last modified: 01 Mar 2018 03:13 by Jeff Watson