


This version is outdated by a newer approved version. This version (18 Feb 2021 15:26) was approved by Brandon Bushey.The Previously approved version (28 Jan 2021 17:14) is available.
This version (18 Feb 2021 15:26) was approved by Brandon Bushey.The Previously approved version (28 Jan 2021 17:14) is available.This is an old revision of the document!
Table of Contents
CN0549 User Guide
CbM requires capturing full bandwidth data to ensure that all harmonics, aliasing, and other mechanical interactions in both the time and frequency domain are accounted for. This data collection requires a high performance sensor and data acquisition (DAQ) system that can provide high fidelity, real-time data into a data analysis tool or application.
Using established tools like MATLAB® or newer Python-based tools like Tensorflow, analyzing the data, profiling the machinery, and creating algorithms for smart decision making is greatly simplified.
Vibration sensing has traditionally dominated most CbM applications because of the availability of sensors, and the science behind the analysis is better understood. The integrated electronic piezoelectric (IEPE) standard is a popular signaling interface standard for high end microelectronic mechanical systems (MEMS) and piezo sensors that are prevalent in the industry today.
CN0549 helps to address these gaps by providing a complete system from sensor to algorithm development.
Required Materials
Hardware:
- Cabling the CN0532 to the CN0540
- Twisted pair set of wires cut to the desired length
- USB OTG (micro USB to USB Type A female USB 2.0 Compatible)
- Wireless Keyboard and mouse with USB Dongle
- Male to male HDMI Cable
This page will focus on using the DE10-Nano board, but it is also possible to create the CN0549 setup connected to a CoraZ7-07s FPGA platform. For more information on how to use the CoraZ7-07s platform please click here.
Software:
Setting up and Configuring the SD Card
To prepare the SD-card for the DE10-Nano board:
- Validate, Format, and Flash the SD Card
Putting together the CN0549
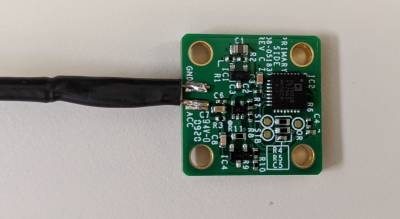
- Take out the CN0532 sensor from its packaging, it will look like this.

- Cut the end of an SMA cable at one end, and solder the center tap to the ACC pad and the outside shield to the GND pad.
- Using the EVAL-XLMOUNT1, mount the CN0532 to the side of the cube using the screws provided. It doesn't matter which side you mount, because you will likely need to change the orientation at the customer.

- Take out the DE10-Nano, it will look like this.

- Make sure that the FPGA Configuration Mode Switch is set at the following positions.

- Insert the programmed micro SD Card into the slot provided on the bottom of the DE10-Nano board.

- Make sure you push the SD card all the way into the slot, as its spring loaded and isn't inserted until it clicks all the way in.

- Take of the CN0540 data acquisition(DAQ) board, it will look like this.

- Orient the CN0540 DAQ board so that the SMA connector is on the same end as the Ethernet jack of the DE10-Nano.
- Find the Arduino header pins on the CN0540 and line them up with the mating Arduino connectors found on the DE10-Nano.


- Once both rows of pins are lined up, push the CN0540 DAQ board down into the DE10-Nano so that the boards fit snuggly together.
 Note, the CN0540 will make solid contact with the DE10-Nano even with the plexiglass installed, so there is no need to remove that before connecting the two boards together.
 - Connect the SMA cable from the CN0532 sensor board to the SMA connector on the CN0540 DAQ board.


- Next its time to connect the peripherals up to the DE10-Nano
- Connect up the USB On the GO(OTG) cable using the micro USB port on the DE10-Nano.

- Place the wireless keyboard/mouse dongle into the end of the USB OTG cable.

- Place one end of the HDMI cable into the HDMI connector on the DE10-Nano.


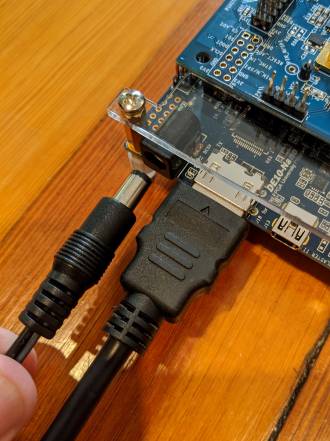
- Connect the 5V power supply to the power jack provided on the DE10-Nano.


Booting
Now that you have everything plugged into the DE10-Nano and the CN0540 boards, its time to boot the system.
Make sure that your HDMI cable is connected into your HDMI monitor before applying power to the DE10-Nano board
- Plug the DC power supply into your power outlet.
- You'll notice that the several LEDs turn on, and after about 5-10 seconds the “User LED” on the DE10-Nano near the Ethernet jack will turn on (it should be solid orange).
- This indicates that software image has booted up properly.
- You should see the ADI Kuiper Linux image home screen up on your HDMI monitor, after the DE10-Nano has booted
- Use your USB wireless mouse, move to the “start button” on the home screen, navigate down to “Other”.
- Find and open the IIO-Oscilloscope application.
- You will be prompted for a password, type in analog and press <Enter>
Using the System with IIO Oscilloscope
Now its time to start communicating with the CN0540 so you can start streaming data. When you first open IIO-Oscilloscope you'll see two windows.
- CN0540 Plugin / DMM / DEBUG Window
- IIO Capture Window
CN0540 IIO-Oscilloscope Plugin
The CN0540 IIO Plugin automatically configures the CN0540, so it is ready to use as soon as you run the application. Calibration of the sensor is also automatically performed so that a user can start using the capture window to collect and analyze data. No other configuration is required for the application.
If you want to re-calibrate the system, shut the system down, or modify individual registers of the devices on the CN0540 that can also be done either using the CN0540 Plugin or using the DEBUG panel to write/read specific registers. This is optional and typically application specific.
Below is a picture of what the CN0540 IIO Plugin looks like.


User interface
| Section | User Control | Description | Value |
|---|---|---|---|
| Power Control | SW_FF | Checks the current status of the ADG5421's FF Pin | Low(normal) High(over voltage) |
| Shutdown | Shutdowns power from the AD7768-1 | Disabled(Power On) Enabled(Power down) |
|
| ADC Driver Settings | FDA Status | ADA4945 Operational Status | Checked(Enable) Un-Checked(Disabled) |
| FDA Mode | ADA4945 Power Mode | Checked(Full Power) Un-Checked(Low Power) |
|
| Sensor Calibrations | Calibration Result | The Calibration is set for a 10V calibration | 10.0V |
| Input Voltage(mV) | Calibrated AD7768-1 Input voltage offset | ~ 0.0V | |
| Shift Voltage(mV) | Calibrated LTC2606 Level Shifting Voltage | ~ 0.0V | |
| Sensor Voltage(mV) | Calibrated Sensor Input voltage | ~ 10.0V | |
| Voltage Monitor | Vin+ (mV) | Input voltage coming from the sensor | |
| Vgpoi2 (mV) | Not Used | N/A | |
| Vgpoi3 (mV) | Not Used | N/A | |
| Vcom (mV) | ADA4945 Common Mode input voltage | ~2.5 V | |
| Vfda+ (mV) | AD7768-1 Ain+ input voltage | ||
| Vfda- (mV) | AD7768-1 Ain- input voltage |
IIO Capture Window
For CbM applications, most customers are typically interested in the frequency domain plots. To obtain a FFT plot, do the following:
- Use the drop down menu labeled “Plot Type” and select “Frequency Domain”.
- Set the number of samples to 16384
- Set the averaging to 3
You should see a nice plot like this when connected to the CN0532 sensor.
Additional Information and Useful Links
Reference Demos & Software Examples
Data Science Examples
Alternate Data Acquisition Setups
Standalone Demo Kit
End of Document
resources/eval/user-guides/circuits-from-the-lab/cn0549.1613652727.txt.gz · Last modified: 18 Feb 2021 13:52 by Sergiu Cuciurean