


This version is outdated by a newer approved version. This version (17 Aug 2021 19:06) is a draft.
Approvals: 0/1
This version (17 Aug 2021 19:06) is a draft.Approvals: 0/1
This is an old revision of the document!
Table of Contents
EVAL-CN0548-ARDZ Shield Overview
Testing and evaluating power systems in industrial and communications settings often requires multiple voltage and current measurements. Individual supplies may be referenced to different grounds, have either positive or negative polarity, or may be galvanically isolated with respect to other power domains. Such scenarios necessitate either individual floating multimeters, or multichannel meters with per-channel isolation, which are physically cumbersome and expensive. The circuit shown in figure 1 is a complete, isolated current and voltage measurement system for industrial, telecommunications, instrumentation, and automated test equipment (ATE) applications. The system is galvanically isolated from the host controller and will tolerate up to +/-250V between the host computer and measurement system grounds. The current input range is +/-10 amps, and voltage input range is selectable between +/-16V and +/-80V. Both voltage and current inputs feature 16-bit resolution with adjustable output data rate and signal bandwidth, including modes that reject both 50Hz and 60Hz line noise. CN0548 is compatible with 3.3V and 5V Arduino form-factor platform boards. Isolation circuitry includes both digital data and power; no additional power source is required from the circuit being measured. The digital interface is SPI (Serial Peripheral Interface) with options for remapping the CS (chip select) signal for compatibility with additional stacked Arduino shields. When paired with the ADICUP3029 and open-source firmware example, application software can easily communicate with the CN0548 over the industry-standard Industrial Input/Output (IIO) libiio library, which includes bindings for C, C#, MATLAB, Python, and LabVIEW.


EVAL-CN0548-ARDZ Simplified Block Diagram

General Setup
Equipment needed
- Multimeter
- Bench top Variable power supply source ( ex. Agilent e3631)
- USB CABLE micro Type B to Type A
- 3 pieces banana to banana jack

firmware for .hex file and CNO548 GUI applicatiom for basic reading task of voltage sensing and current sensing
1. Connect the USB micro cable to EVAL-ADUCM3029 to PC. Unzipped the provided file folder “ad7799_prj.zip” and navigate to firmware “EVAL_CN0548_ARDZ.hex. Drag and drop the firmware on the DAPLINK folder.
Zip folder for .hex firmware and EVAL-CN0548-ARDZ GUI

2. Follow the figure below for the position of shunt jumpers for headers P1, P3, P10, P8, P9, and P11. Make sure that is set at 16V max input for the voltage sensing, follow jumper settings stated in the table below encircled in red for 16V maximum input.


3.Place all the shunt jumpers connected to GND, headers P12, P13, P14 and P7 as default position for measurements in unipolar mode. Refer to the figure below for correct jumper settings.

4. Referring to step 1, where you uploaded the .hex file firmware to ADICUP3029. Now run the executable GUI “ad7799_py_new.exe” located inside “ad7799_app” folder. It will take for about a minute before the CN0548 app will show up on your PC display. Please see figure 6 for CN0548 GUI upon start. Once the application is running, determine the comport at your device manager window and type it in the “COMPort “ number. See figure below for device manager comport number. Then input the correct comport number then press “connect” button see figure 8 for successful connection.
Demo Requirements
A sample code for the board is already provided. The following is the list of items needed in order to run the given script.
Hardware:
- EVAL-CN0548-ARDZ
- EVAL-ADICUP3029
- Micro USB to USB cable
- PC or Laptop with a USB port
Software:
- Pre-build HEX file
- Python 3.7 or later versions
- Script for data logging and plotting - CN0548_simple_plot.py
Setting up the Hardware
- Attach the EVAL-CN0548-ARDZ shield to the EVAL-ADICUP3029 .
- Connect a micro-USB cable to the P10 connector of the EVAL-ADICUP3029 and connect it to a computer.
Flashing the Firmware/Program
The easiest way to get started with the CN0548 board is by using the pre-built hex file for the EVAL-ADICUP3029. Follow the steps provided:
- Make sure that the on-board switches of the EVAL-ADICUP3029 are configured as shown on the table below:
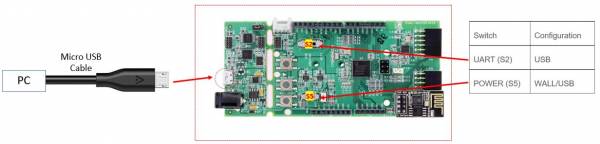
- Connect the ADICUP3029 to the PC host via micro-USB cable.
- From the PC, open My Computer and look for the DAPLINK drive, if you see this then the drivers are complete and correct.
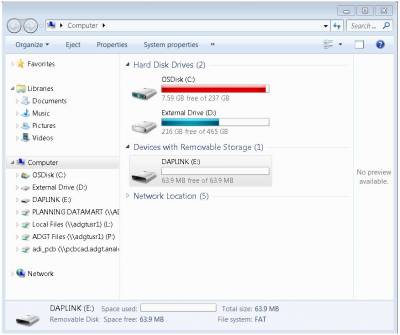
- Download the .hex file from the provided link below. Simply drag and drop the .hex file to the DAPLINK drive in order to upload the program to the ADICUP3029. The DS2 (red) LED will blink rapidly. It will stop blinking and will stay ON once the uploading is done.
- Disconnect then reconnect the EVAL-ADICUP3029 to the host computer.


For advanced applications, you may opt to build, compile, and debug the given project by installing the CrossCore Embedded Studio (CCES) environment. This method will allow you to explore the board capabilities in detail as well as have a customized project to fit your needs.
The software for the ADICUP3029_CN0548 demo can be found here:
Prebuilt CN0548 Hex File
Complete CN0548 Source Files
PyADI-IIO
PyADI-IIO is a python abstraction module for ADI hardware with IIO drivers to make them easier to use. This module provides device-specific APIs built on top of the current libIIO python bindings. These interfaces try to match the driver naming as much as possible without the need to understand the complexities of libIIO and IIO.
Install PyADI-IIO using one of the methods in PyADI-IIO.
Cloning the Repository and Setting up the PyADI-IIO Enviroment
- Clone the pyadi-iio master repository. Create a folder where you want to clone the repository, navigate to this folder using a terminal (command prompt for Windows) and enter the following command:
git clone https://github.com/analogdevicesinc/pyadi-iio.git
- Navigate into the pyadi-iio folder and install the required packages for the demo. Enter the following commands:
pip install -r requirements.txt
We will also be needing the matplotlib package for the plotting of data:
pip install matplotlib
- Lastly, finish the environment setup by invoking the setup.py file.
python setup.py install
In case your system is specifically designed for a certain application, you may want to consider using a virtual environment in doing this demo. It should also help in dealing with system config and version issues.
Running the Example
The sample code provided already comes with a number of useful features for the convenience of the user. Upon startup, it will provide a simple graphic aid in order to help the user configure the board jumpers for the user's desired specification. Aside from displaying the numerical readings of the board, the sample code already has built-in data logging and real-time plot features. It also has a memory feature that allows the user to reuse the configuration of the previous session and immediately start sensing data.
Starting a new session
- Download the given python script into the examples folder of the pyadi-iio directory. Using a terminal, navigate to the said folder and invoke the script.
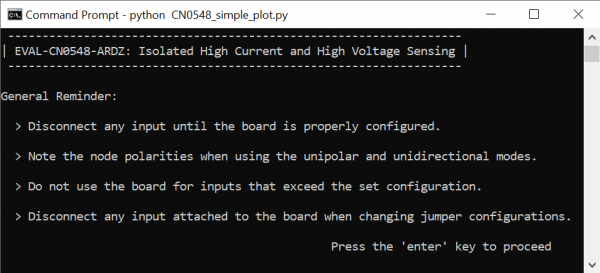
python CN0548_simple_plot.py
Below is a copy of the python script:
CN0548_simple_plot.py
to be updated - Upon running the script, some general reminders regarding the board usage will be displayed. Make sure to read these reminders before proceeding. Press the Enter key to proceed.
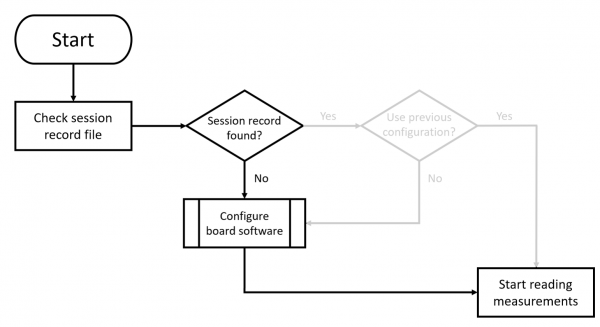
- As mentioned earlier, the board has a memory feature that allows the user to quickly configure the sample code using the configuration from the last session. The user can decide whether to reuse the previous setting or set up a new configuration. The next items will discuss the program flow given that no session record file is found i.e. first run of the sample code.
- In a separate window, the program will first create a simple jumper map that corresponds to the jumpers on the board — this might take a few seconds depending on the user's machine. The program will then prompt the user for the voltage and current modes to be used.
 The user will be asked to specify whether the voltage measurements would be unipolar or bipolar as well as the expected range of values to be sensed. On the other hand, the user only needs to specify whether the current measurements would be unidirectional or bidirectional. The jumper map will be updated as the user answers the configuration queries.
 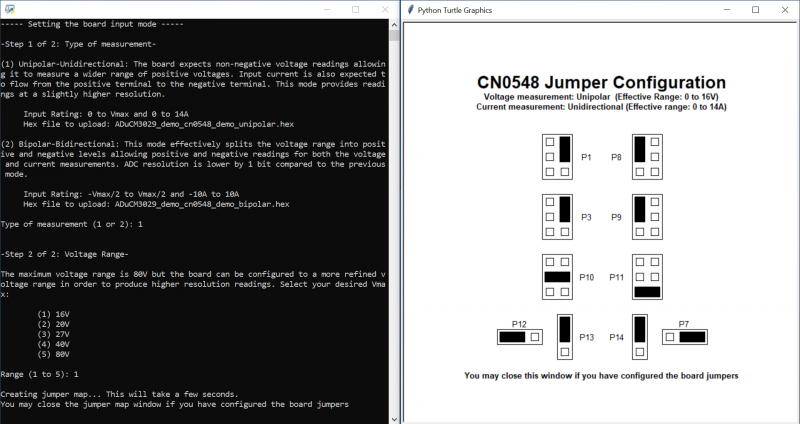 Configure the board jumpers as shown in the jumper map and press the Enter key to proceed. In this example, the jumper map shows a 16V unipolar 20A unidirectional configuration.
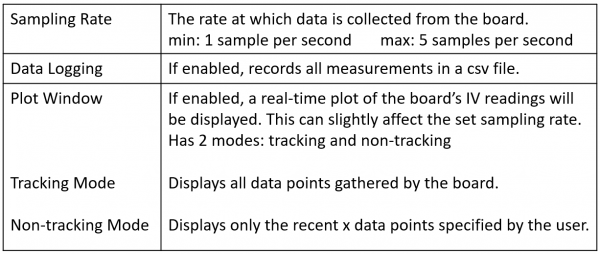
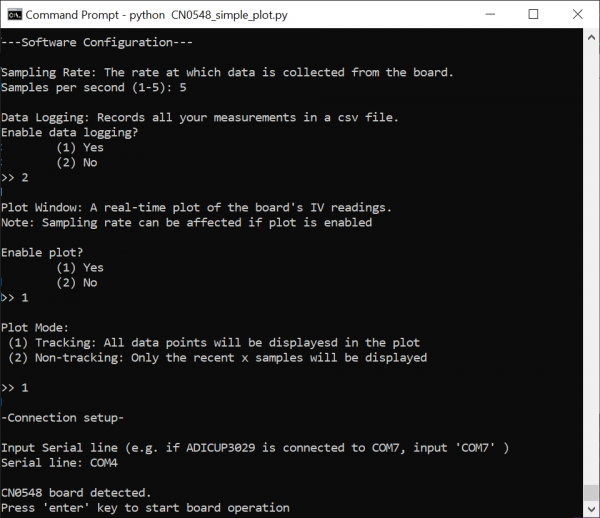
- After the board jumper configuration guide, the program will now begin its software configuration related queries. The table below shows the aspects that the user must configure.
- Lastly, the sample code will ask the user for the port where the ADICUP3029 is connected. If the port is found, the sample code is now ready to parse readings from the board. Press Enter key to start board operation.
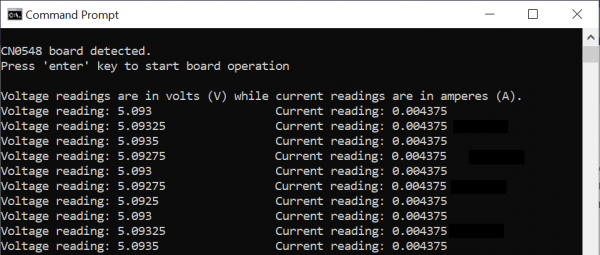
Regardless of whether the plot window is enabled or not, the board readings will be continuously displayed in the terminal.
In the next two figures, the CN0548 was used to monitor the performance of a 5V regulator. The first figure shows a plot in tracking mode where all data points are displayed. The second figure on the other hand is in non-tracking mode where the last 50 samples are being displayed.
Tracking Mode: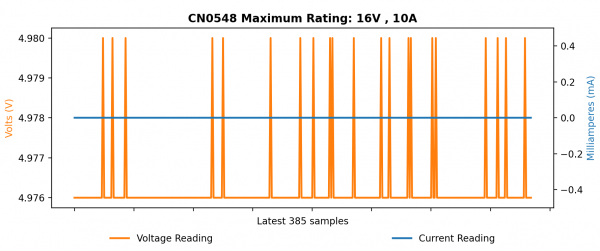
Non-tracking Mode: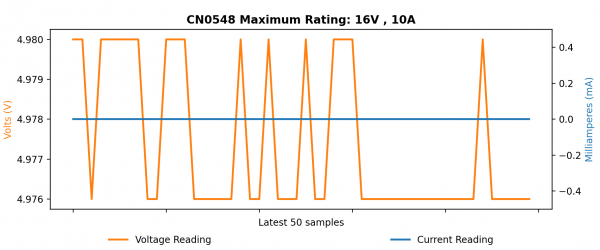
Tracking mode allows the user to observe the overall characteristic of the signal being measured. However, it should be noted that the plot will continue to compress as more data points are added. Non-tracking mode on the other hand allows a more refined view as it only shows the most recent measurements as desired by the user.


Do note that the plot windows are created using the matplotlib package of python. Hence, you have the option to save a copy of the displayed waveform at any point in time. This comes in handy when an unexpected noteworthy event happens and the data logging feature was not enabled.
Data Logging
The data logging feature allows the user to log all measurements into a csv file. If enabled, the csv file will be created in the same folder where the sample code is located and will follow the naming scheme CN0548_[timestamp]. However, the saving of data is slightly different when the plot window is enabled. 
When the plot window is not utilized, new data measurements are immediately saved into the csv file as new data points are read from the board. On the other hand, when the plot window is active, data points will only be saved upon closing the plot window. This is done in order to facilitate a smoother environment. Note that premature termination of the program by directly closing the terminal will result to loss of data. This reminder is also displayed in the plot window whenever data logging is enabled. ![]()
Memory Feature
 The memory feature of the board allows the user to quickly configure the sample code using the setup from the previous session in order to begin sensing data immediately. This is done by saving all user input and creating a session_record text file in the same directory where the sample code is located.
  Note that the contents of the session record file is not encrypted and is easily understandable. Each line begins with a number which corresponds to a certain setting. For instance, 1 corresponds to the Unipolar voltage setting and 2 will correspond to the Bipolar voltage setting. Hence, if the user just wants to reconfigure a minor aspect of the setup (use tracking mode instead non-tracking, adjust the sampling rate, enable or disable data logging, etc.), the user can quickly reconfigure the sample code by editing the session_record file. The program is able to detect whether the set of specifications in the session record is valid or not. If the configuration set by the user is not valid, the program will still proceed as usual and will assume no session record file was detected.
 If the user chooses to use the configuration loaded from the session record, the only query left to be answered is the port where the ADICUP3029 is attached. The program does not save the previous port used since the device might be connected in a different port of the machine.
resources/eval/user-guides/circuits-from-the-lab/cn0548.1629220000.txt.gz · Last modified: 17 Aug 2021 19:06 by Harvey John De Chavez