


This version (29 Jul 2021 07:58) was approved by Harvey John De Chavez.The Previously approved version (03 Jan 2021 22:03) is available.
Table of Contents
CN0372 Evaluation Board and Software User Guide
Overview
CN0372 is a multi-channel data acquisition system suitable for ultra-low power applications. The circuit is configurable for buffered and unbuffered operation as well as for power supply options.
The AD7091R-5 accepts the analog signals, buffered or unbuffered, and performs data conversion. The ADA4805-1 is an optional buffer which can be used for all input channels because of an access to the multiplexer output of the AD7091R-5. The ADP5090 harvests charge from a photovoltaic cell to generate the system DC supply rails. Another option provided to power the board is with the ADP1607. A CR2032 battery connector is available to provide either the input to the ADP1607 or accelerate the cold start of the ADP5090.
This user guide will discuss how to operate the SDP-PMD-IB1Z, EVAL-SDP-CB1Z and the evaluation software to configure and collect data from the EVAL-CN0372-PMDZ Evaluation Board (CN0372 Board). The evaluation board also has PMOD and IMOD compatible headers which allows for connection to other processors or microcontrollers.
A complete design support package for the EVAL-CN0372-PMDZ evaluation board containing schematics, layouts (native and Gerber), and bill-of-materials can be found at: CN0372-DesignSupport.

Required Equipment
- EVAL-CN0372-PMDZ Evaluation Board
- EVAL-SDP-CB1Z Controller Board (SDP-B Board)
- SDP-PMD-IB1Z Interposer Board (Interposer Board)
- 8-pin IDSD-04-D flexible cable
- PC with a USB port and Windows® XP or Windows Vista® (32-bit), or Windows 7 (32-bit)
- USB cable
- Power supply: 6 V wall wart
- SRS DS360 Ultralow distortion Function Generator or similar precision source
- Cymbet CBC-PV-01 PV Cell
- CR2032 battery
General Setup

- The CN0372 Board connects to the Interposer Board via J2 and J3
- The Interposer board connects to SDP-B Board via the 120-Pin connector
- The SDP-B Board connects to the PC via the USB cable.
- Header J2 is an 8 pin PMOD compatible I2C interface header - allows for communication to the ADC
- Header J3 is a PMOD Inerface Type 2A header - allows for communication to the ADC
- Terminal block J1 provides the quad channel input (input range:0 to 2.5V)
- Terminal block J4 provide the PV cell input
- Terminal block B3 provide the backup battery option
Power Supply Configuration
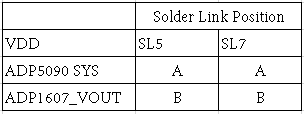
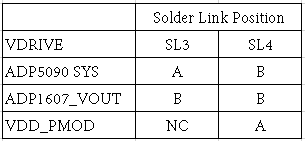
To use ADP5090 energy harvesting circuit as system supply, connect a PV Cell to J4 terminal and place SL4 and SL5 to A before opening the evaluation software. VDRIVE is taken from VDD_PMOD. For the complete power supply options available, see tables below.
VDD Options
VDRIVE Options
Solder Link Settings

Test Points
There are numerous test points on the CN0372 Board. These test points provide easy access to the signals from the evaluation board for probing, evaluation, and debugging.
Installing the Software
- Extract the file CN0372_Evaluation_Software.zip and open the file setup.exe.

NOTE: It is recommended that you install the CN0372 Evaluation Software to the default directory path C:\Program Files\Analog Devices\CN0372\ and all National Instruments products to C:\Program Files\National Instruments\
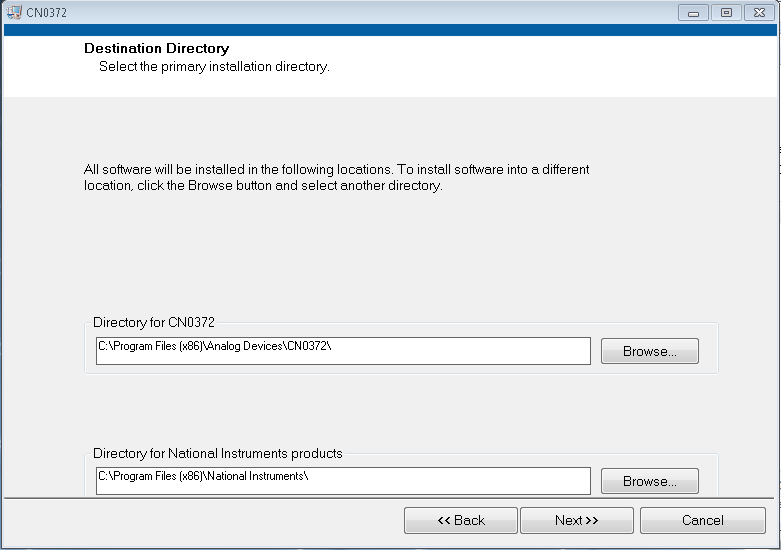
- Click Next to view the installation review page.
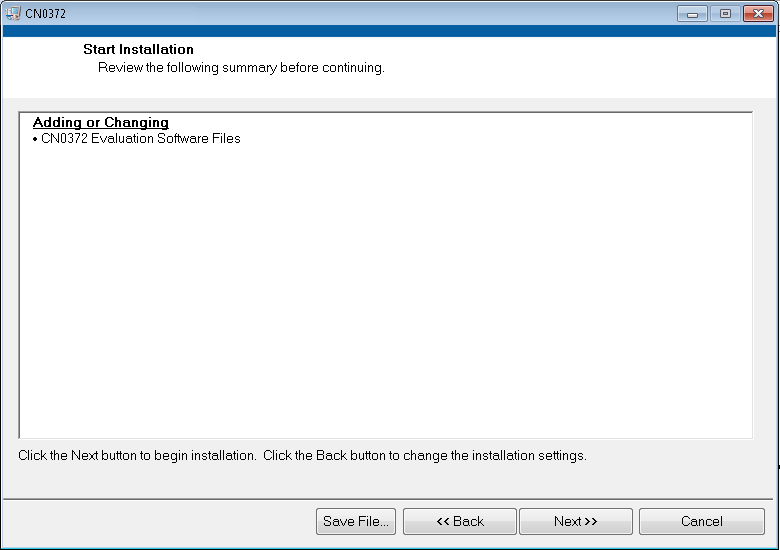
- Click Next to start the installation

- Upon completion of the installation of the CN0372 Evaluation Software, click Next for the installer of the ADI SDP Drivers to execute.

NOTE: It is recommended that you close all other applications before clicking “Next”. This will make it possible to update relevant system files without having to reboot your computer.

- Press “Next” to set the installation location for the SDP Drivers.
It is recommended that you install the drivers to the default directory path
C:\Program Files\Analog Devices\SDP\Drivers

- Press “Install” to install the SDP Drivers and complete the installation of all software. Click “Close” when done.

Using the Evaluation Software
Software Control and Indicator Descriptions
Main Tab

NOTE: Blocks 6,7,8 and 10 have expand buttons ( ) that when clicked brings up the window shown in these blocks' description.
- Analysis Ch
- Selects the channel analyzed and the channel whose parametric performance data is displayed in the plot analysis blocks.
- Samples
- Selects number of samples to be taken in a single acquisition.
- Single Capture
- Initiates the sampling and readback of the defined number of measurements.
- Continuous Capture
- Continuously captures and updates the display and chart. Click a second time to stop sampling.
- Device Status
- Displays the device generic and operating mode.
- I/P MUX
- Writes to the channel register.

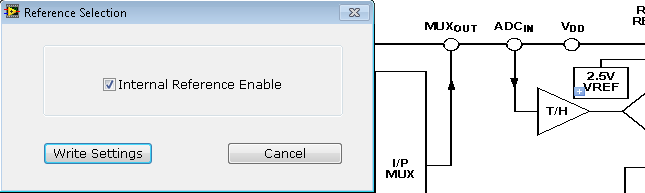
- 2.5 Vref
- Source of the Reference Input.
- Control Logic and Registers
- Writes to the configuration Register.

- SCL Rate
- Selects the SCL clock rate. Standard mode is 100 kHz. Fast mode is 400 kHz. Fast mode is the default configuration.
- Alert Register
- Writes to the Alert Register

- DPS Duty Cycle
- Duty cycle dropdown menu. Options from 10% to 90%.
- Reference Settings
- Displays current reference setting. If External Reference is selected, provide an off-board external reference. If this option is selected, the supplied reference value must be entered in Ref. Value.
- DPS
- Toggles dynamic power scaling when ADA4805-1 is used.
- Amp PD
- Toggles power down of buffer when ADA4805-1 is used.
- Flash LED
- Flashes LED1A on the SDP-B board, useful for debugging purposes.
- Reset
- Resets ADC and places the default configuration in the control register.
- Status Bar
- Displays a message to the user detailing the current state of the software.
Waveform Tab
- Displays amplitudes recorded from the captured signal as well as the frequency of the signal tone. The analysis report is generated for the channel selected via the Analysis Ch. drop-down menu.

- Analysis Ch
- Selects the channel analyzed and the channel whose parametric performance data is displayed in the plot analysis blocks.
- Alert
- Illuminates if an alert is generated.
- Plot Legend
- Shows all enabled channels. To remove any undesired channel(s) from the plot, deselect that channel.
Histogram Tab
- Tests the ADC for the code distribution of the AC or DC input and computes the mean and standard deviation, or transition noise of the converter, and displays the results.

FFT Tab
- Tests the traditional ac characteristics of the converter and displays a fast Fourier transform (FFT) of the results. As in the histogram test, raw data is captured and passed to the PC where the FFT is performed, displaying SNR, SINAD, and THD.
- The Spectrum Analysis panel displays the performance data: SNR, THD, SINAD, dynamic range, and noise performance along with the input signal characteristics.
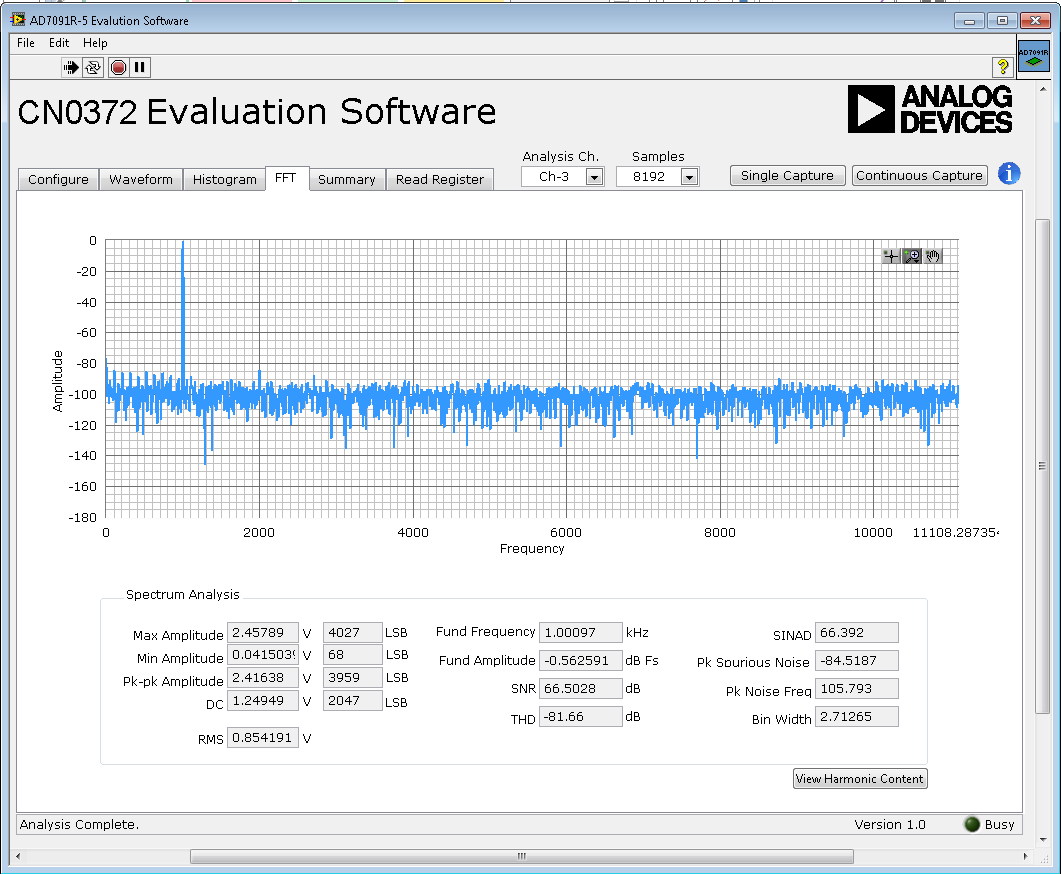
- View Harmonic Content button switches the panel to display the frequency and amplitude of the fundamental in addition to the second to fifth harmonics.

Summary Tab
- Presents a summary of the waveform, histogram and FFT data, including key performance parameters, such as SNR and THD.

Read Register Tab
- Displays register contents

- The Channel Register tab indicates the current enable/disable state of all channels.
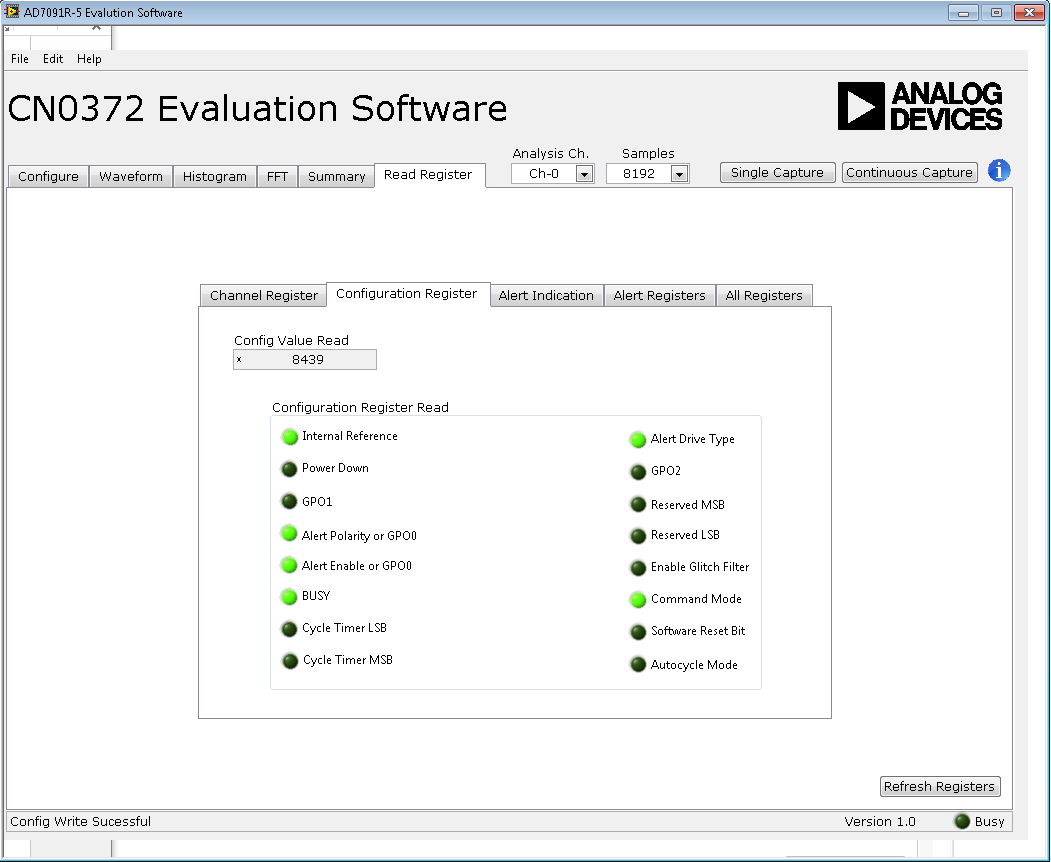
- The Configuration Register tab indicates the configuration state of the AD7091R-5.
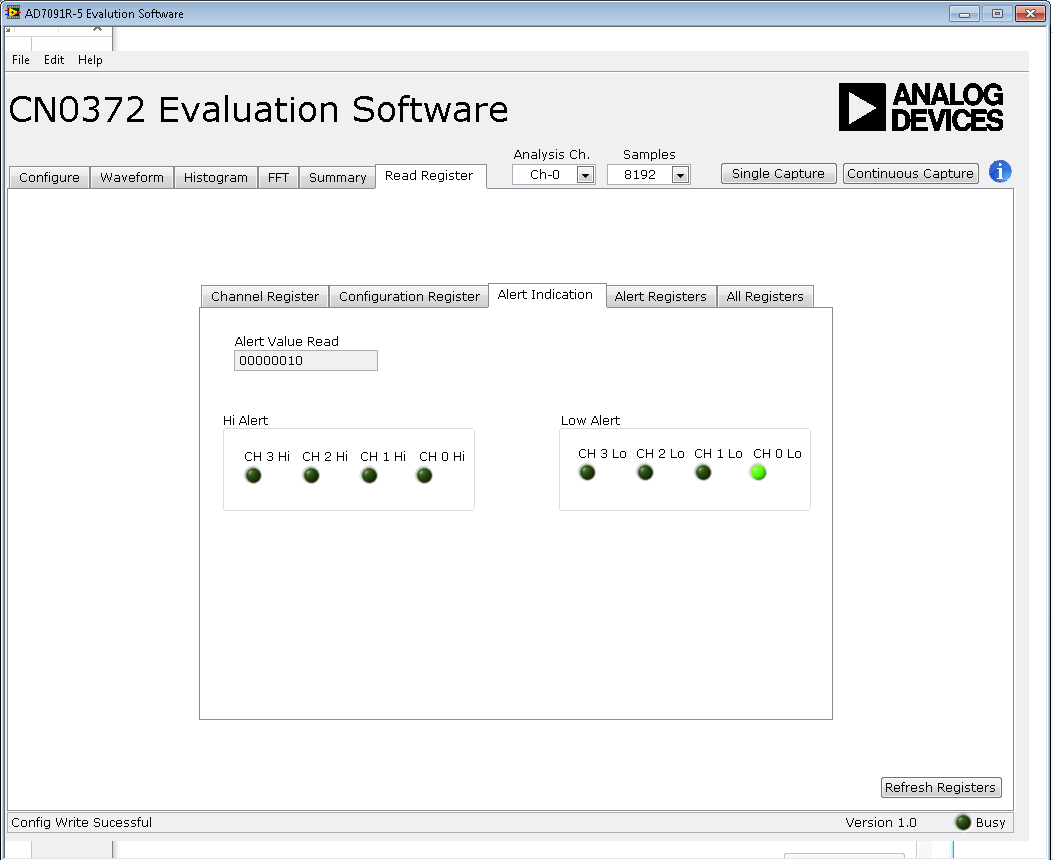
- The Alert Indication tab indicates the current high and low alert status of individual channels.
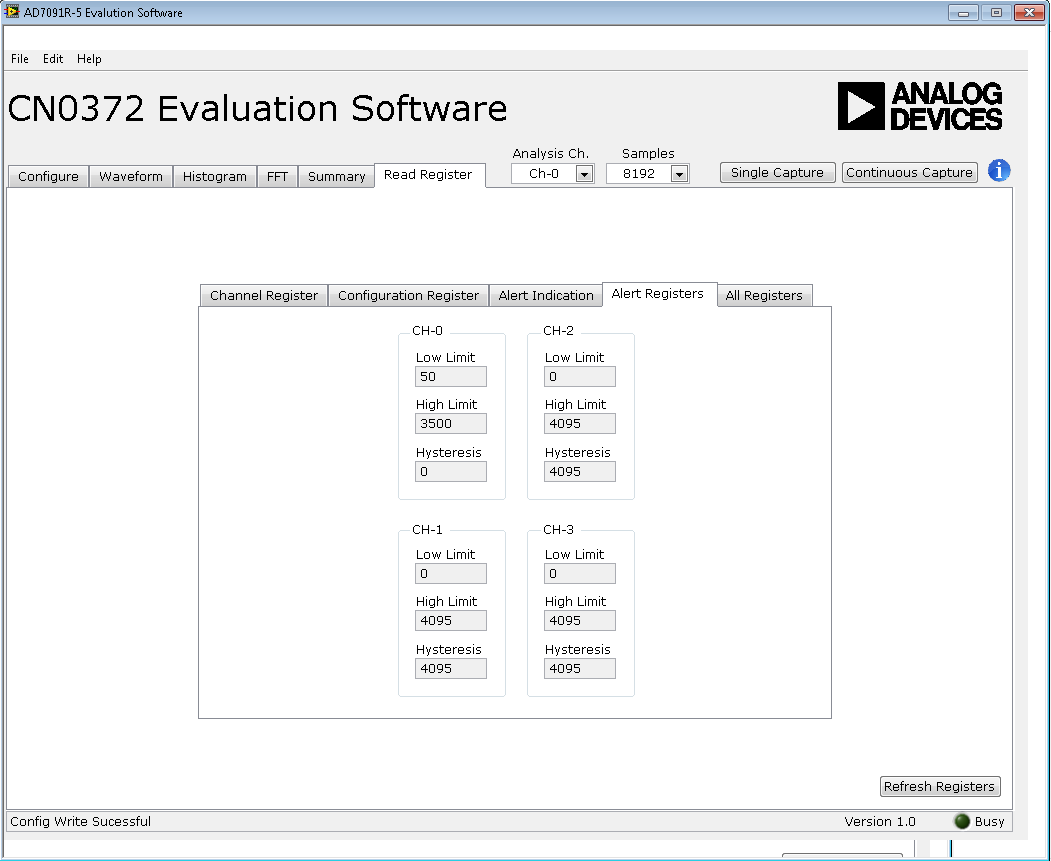
- The Alert Registers tab indicates the current high, low, and hysteresis alert register values that are programmed into the AD7091R-5 control registers.

- The All Registers tab displays all current register values contained within the AD7091R-5.
Running the System
- Open the CN0372.exe application from the default installation location.
- The software will connect to the board automatically.
- Click the Single Capture or Continuous Capture Button.
Saving Files
The software can save the current captured data for future analysis. The software has the ability to capture the current plot images and the current device configuration, as well as the raw waveform data, histogram data, and ac spectrum data.
Saving Data to a Spreadsheet File
- Click on File Menu.

- Select Save Analysis Data
- Select data to save.
- Name the file.
- Click the OK Button.
Saving Image to File
- Click on File Menu.
- Select Save Picture.
- Select image to save.
- Name the file.
- Click the OK Button.
Saving Device Configurations
- Click on File Menu.
- Select Save Register Configuration.
- Name the file.
- Click the OK Button.
Opening Files
The software can load previously captured data for analysis or previously utilized device configuration.
- Click on File Menu.
- Select Open.
- Load saved data or register configuration.
- Click the OK Button.
More Information and Useful Links
Registration
Receive software update notifications, documentation updates, view the latest videos, and more when you register your hardware. Register to receive all these great benefits and more!
resources/eval/user-guides/circuits-from-the-lab/cn0372.txt · Last modified: 29 Jul 2021 07:58 by Harvey John De Chavez