


This version (19 May 2022 13:24) was approved by Cian McNamara.
Table of Contents
Software Guide
Ace Plugin
Ace Plugin Install guide
- Warning: The evaluation software and drivers must be installed before connecting both the evaluation board and the Controller (SDP) board to the PC. This ensures that the evaluations system is correctly recognized when it is connected to the PC.
The software and drivers required for the installation walked through in this section can be found below:
Installing the ACE Plugin software
Download the ACE software from the ACE software page or the AD4130-8 product page. Install ACE on a PC before using the EVAL-AD4130-8WARDZ.
Installing ACE
- Download the ACE software to a Windows®-based PC.
- Double click the ACEInstall.exe file to begin the installation. By default, the software is saved to the following location: C:\Program Files (x86)\Analog Devices\ACE.
- A dialog box opens asking for permission to allow the program to make changes to the PC. Click Yes to begin the installation process.
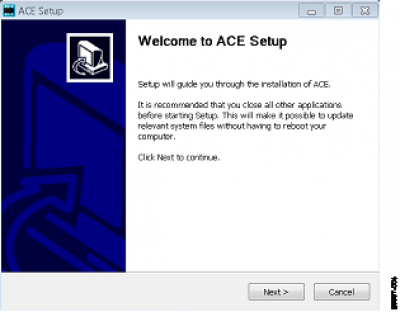
- In the ACE Setup window, click Next > to continue the installation.
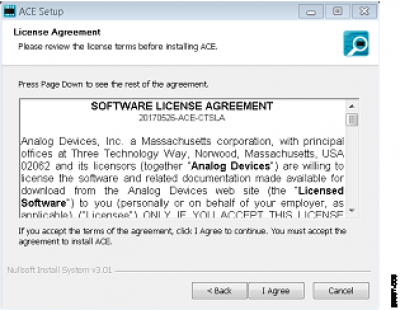
- Read the software license agreement and click I Agree
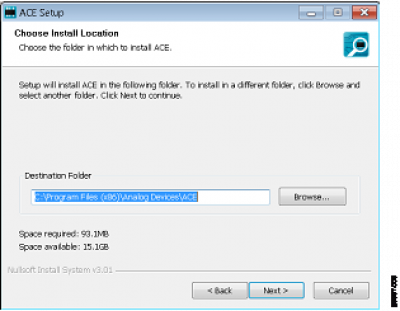
- Click Browse … to choose the installation location and then click Next >
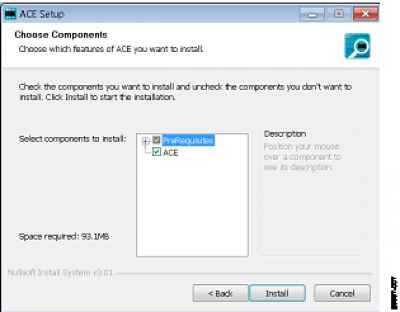
- The ACE software components to install are preselected. Click Install.
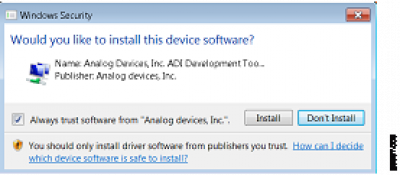
- The Windows Security window opens . Click Install
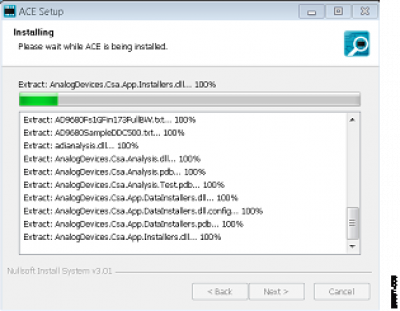
- The installation in progress in the window below. No action is required.
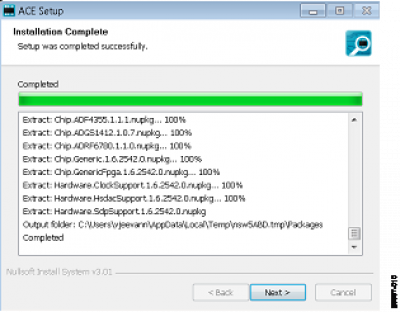
- When the installation is complete, click Next >, and then click Finish to complete the installation process


AD4130-8 Plugin Install
After the AD4130-8 Plugin is downloaded follow the steps to install the file: - Double click on the AD4130-8 Plugin. - Connect up your EVAL-AD4130-8WARDZ to your pc through a controller board. Alternatively, the AD4130-8 Plugin can be installed through the steps bellow:
- From the Start menu of the PC, select All Programs > Analog Devices > ACE> ACE.exe to open the ACE software main window shown below.
- Click on the Plug-in Manager Tab in the top left panel in Ace.
- Click on the Settings… button.
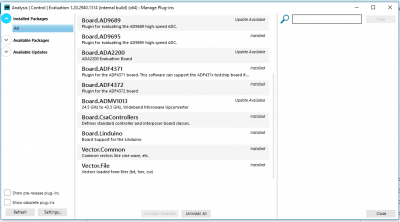
- Hit the + button next to the Zipped Plug-in Sources.

- Under the Name write “AD4130-8”
- Under Source hit the … button and set the path to where you have stored the AD4130-8 Plugin.
- Press “Ok”.
- Press “Close”.


ACE software Operation
Launching the software
After the EVAL-AD4130-8WARDZ and controller board are properly connected to the PC, launch the ACE software by taking the following steps:
- From the Start menu of the PC, select All Programs > Analog Devices > ACE> ACE.exe to open the ACE software main window shown below
- If the EVAL-AD4130-8WARDZ is not connected to the USB port via the controller board when the software launches, the AD4130-8 Eval Board icon does not appear in the Attached Hardware section in ACE (see Figure below).To make the AD4130-8 Eval Board icon appear, connect the EVAL-AD4130-8WARDZ and the controller board to the USB port of the PC, wait a few seconds, and then follow the instructions in the dialog box that opens.

- Double click the AD4130-8 Eval Board icon to open the AD4130-8 Eval Board view window shown below:

- Double click the AD4130-8 chip icon in the AD4130-8 Eval Board view window to open the AD4130-8 chip view window shown below:
- Click Software Defaults and then click Apply Changes to apply the default settings to the AD4130-8 (see figure below)


Chip view window
After completing the steps in the Software Installation Procedures section and the Evaluation Board Set-up Procedures section, set up the system for data capture by taking the following steps:
- Block icons that are dark blue are programmable blocks. Click a dark blue block icon to open a configurable pop-up window to customize the data capture.
- The “Proceed to Memory Map” button brings the user to the memory map of the AD4130-8. This allows the user to configure the AD4130-8.
- The “Proceed to Analysis” button brings the user to the Analysis tab. This allows the user to see the performance results of the AD4130-8 and displays the data.
Waveform Window
The Waveform tab graphs the conversions gathered and processes the data, calculating the peak-to-peak noise, rms noise, and resolution.
1) Waveform graph and controls
The data waveform graph shows each successive sample of the ADC output. Zoom in on the data in the graph using the scroll wheel on your mouse or by selecting the magnifying glass.
2) Analysis Channel
The Result section shows the analysis of the channel selected 
3) Samples
The Samples numeric control set the number of samples gathered per batch. This control is unrelated to the ADC mode. You can capture a defined sample set or continuously gather batches of samples. In both cases, the number of samples set in the Samples numeric input dictates the number of samples. The Noise Analysis section displays the results of the noise analysis for the selected analysis channel, including both noise and resolution measurements.
4) Capture
Click the Run Once button to start gathering ADC results. Click the Run Continuously button to start gathering ADC results continuously. Results appear in the waveform graph (Label 1).
5) Display Units and Axis Controls
Click the Codes drop-down menu to select whether the data graph displays in units of voltages or codes. This control affects both the waveform graph and the histogram graph. The axis controls is fixed. When selecting Fixed, the axis ranges can be programmed; however, these ranges do not automatically adjust after each batch of samples.
6) Histogram Plot
Allows to view an Histogram plot of the data collected.
Memory map Window
Use the Memory Map tab to access the registers of the AD4130-8, shown in the figure below. This tab changes register settings and shows additional information about each bit in each individual register.
1) Export Buttons
The Export buttons on the Register Map tab allow the user to save and load register settings. Click Save to save all the current register settings to a file for later use. Click Load to load a previously saved register map.
2) Register
The Register section shows the value that is set in the selected register. Check the value of the register in this window by clicking on the bits. Clicking any individual bit changes the bit from 1 to 0 or 0 to 1, depending on the initial state of the bit. The register value can also be changed by writing the hexadecimal value in the input field to the right of the individual bits.
3) Bitfields
The Bitfields section shows the individual bitfield of the selected register. The register is broken by name into its bitfields, name of the bitfields, a description of each bitfield, and access information. Show each individual bitfield by pressing the show bitfield button (label 3). Apply these changes using label 4. Search for specific registers using label 5.
6) Register and Bitfield Description and dropdowns
For more information of the register and the bitfields in the register, double click on the register shown by label 2. This will show up the register description shown by label 6. For information on what the bitfield does click on the i button in label 7.

AD4130-8 Demo Modes
Visit the demo mode section here
Contents of the demo modes section:
Active Function Model Guide
This page provides a step by step guide to launching and using ADI's new Active Function Model Tool. The AFM simulates crucial part performance characteristics within seconds. Configure operating conditions such as operation modes and sensor biasing/excitation, as well as device features like gain or FIFO. Performance characteristics include noise, histogram, resolution, power consumption, timing diagrams, response plots, and more.
Visit the Active Functional Model (AFM) section here
Contents of the AFM section:
Firmware Install Guide
resources/eval/user-guides/ad4130-8/softwareguide.txt · Last modified: 17 May 2022 17:10 by Cian McNamara