


This version (15 Sep 2016 22:22) was approved by Larry Welch.
Table of Contents
ACE AD9154-EBZ Evaluation Board Quick Start Guide
Getting Started with the AD9154-EBZ Evaluation Board and Software
What's in the Box
- AD9154-EBZ Evaluation Board for DPG3
- Evaluation Board CD
- Mini-USB Cable
Recommended Equipment List
- +5VDC Lab Power Supply
- Sinusoidal Clock Source
- Spectrum Analyzer
- Oscilloscope
- Data Pattern Generator Series 3 (DPG3)
Introduction
The AD9154-EBZ connects to a DPG3. The AD9154 is a quad JESD204B signal processing RF Digital to Analog Converter. The DPG3 automatically formats the data and sends it to the AD9154-EBZ via its JESD204B lanes. The Evaluation Board (EVB) runs from a single +5V lab supply. A clock distribution chip AD9516 is included on this EVB as a clock fan-out and frequency divider for the DACCLK, JESD204B SYSREF signals, and a CFRAME clock used by the DPG3.
AD9154 Evaluation Software
The AD9154 Evaluation Board software runs on the ADI ACE graphical user interface (GUI). ACE is included on the Evaluation board CD. Registers on the AD9154 and AD9516 products are programmed by the ACE software via a USB cable connecting the user’s PC to the AD9154-EBZ XP2 connector. Firware in the AD9154-EBZ PIC processor (XU1) provides the interface between the USB bus and the SPI busses of the AD9154 and AD9516.
Hardware Setup
Figure 1 shows the block diagram of the set-up.

| Figure 1. AD9154-EBZ Lab Block Diagram |

| Figure 2. Top view of AD9154-EBZ |
Connect +5.0V to P5, GND to P6. A low phase noise high frequency clock source should be connected to the SMA connector J1 (CLK_IN). A spectrum analyzer should be connected to the SMA connector J17. Connect J4, J5, and J7 to an oscilloscope. The evaluation board connects to the DPG3 through the connector P4. The PC should be connected to the EVB using the mini-USB connector XP2. Figure 1 shows a block diagram of the set-up.
Getting Started
The EVB software is included in the CD shipped with the EVB. The installation includes the DPG Downloader software as well as all the necessary AD9154 files including schematic, board layout, datasheet, and other files.
Initial Set-Up
1. Install the DAC software suite and ACE on your PC. Follow the instructions in the installation wizard and use the default (recommended) installation settings.
2. Use a USB cable to connect the EVB to your PC and connect the lab equipment to the EVB.
3. Connect the DPG3 unit to your PC and turn on the unit.
Single Tone Demonstration
These settings configure the AD9154 to output a 112Mhz -1dbFS sine wave using the DPG3 on all four AD9154 DACs.
1. Configure the hardware according to the hardware set-up instructions given in the Hardware Setup section above. Set the frequency of the DAC clock signal generator to 1500MHz, and the output level to 3dBm. The spectrum analyzer can be configured as shown in Figure 7 with a resolution bandwidth of 100kHz. Choose an Input Attenuation of 24dB.
2. Open ACE from Start→Analog Devices→ACE. ACE will come up and display the initial ACE page shown in figure 3a.
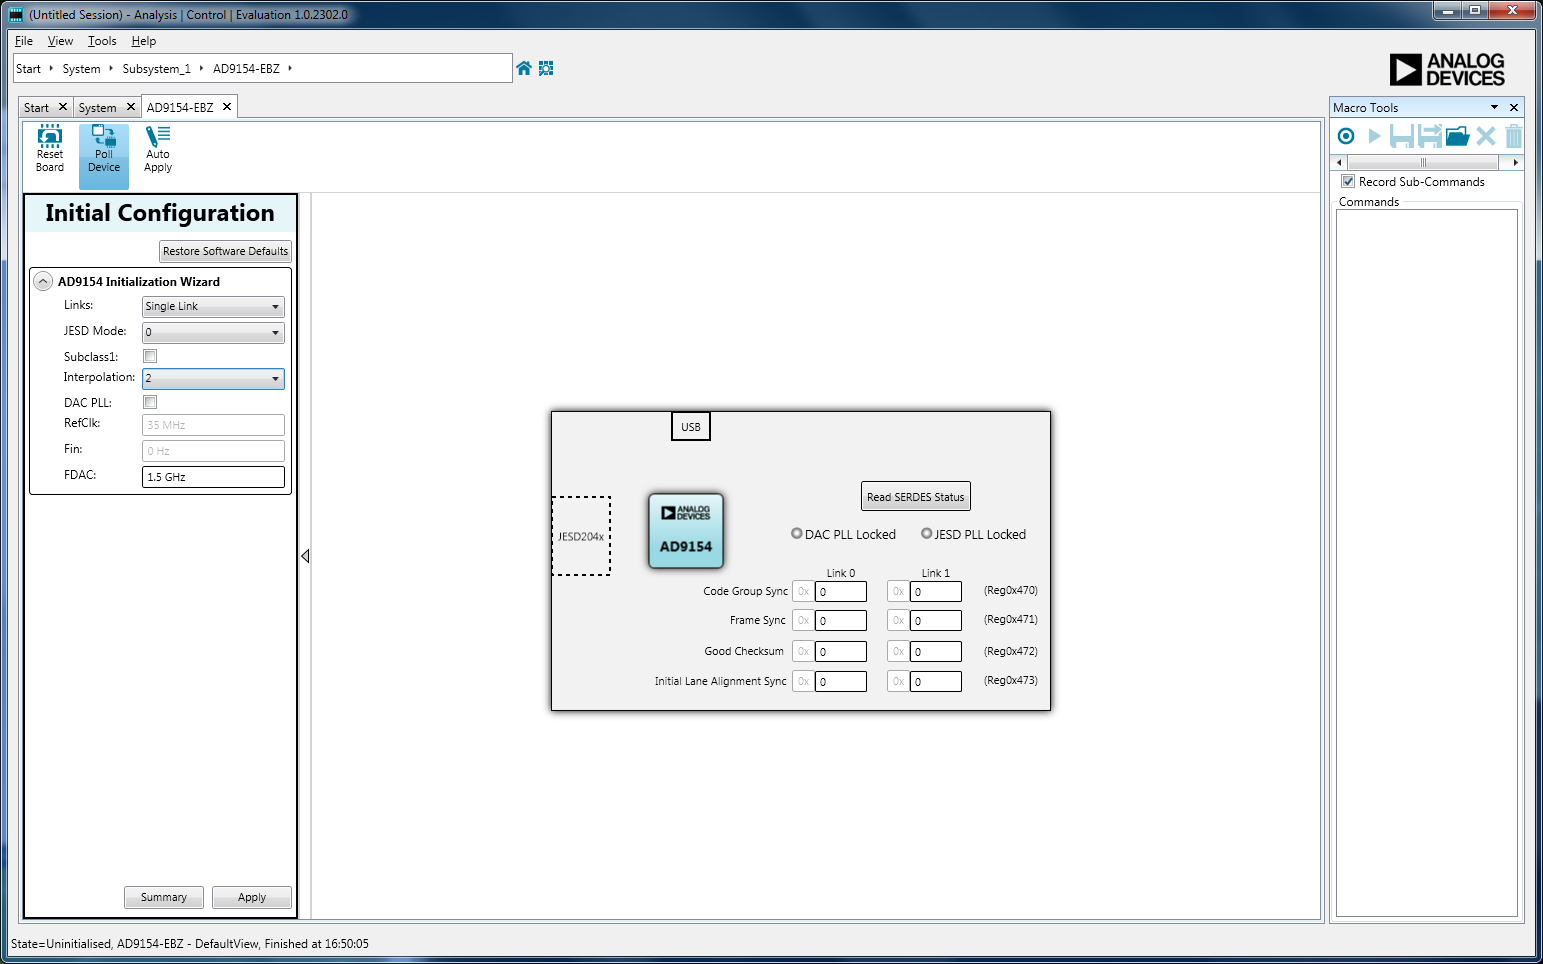
3. Press the AD9154 icon and populate the AD9154 initialization wizard as shown in figure 3b, JESD mode 0, Interpolation 2. Leave all other settings in their default state. Press rhe APPLY button. JESD204B PLL lock will turn green as shown in figure 3c. Press the AD9154 icon in the initialization wizard tab. The AD9154 block diagram view will appear populated as shown in figure 3d.

| Figure 3a. Initial ACE page for AD9154-FMC-EBZ |
| Figure 3b. ACE AD9154 Initialization Wizard tab with selections made |

| Figure 3c. ACE AD9154 Initialization Wizard tab after pressing APPLY |

| Figure 3d. ACE AD9154 Block Diagram View after Initialization |
4. DPGDownloader Start Up Sequence
a. Open DPGDownloader. (Start > All Programs > Analog Devices > DPG > DPGDownloader). DPGDownloader GUI will come up as shown Figure 4.
b. Select the Port configuration QBF 1×8 85G 425M. The configuration progress bar will then show a moving green indication.
c. Once port configuration is complete, select “add generated waveform” and “single tone”.
d. Set Data Rate to 750Mhz, Desired Frequency to 112Mhz, Amplitude to -1.0 dBFS, uncheck unsigned, check Generate Complex Data (I&Q).
e. Under Data Playback, select I data for DAC 0 and DAC2, and Q data for DAC 1 and DAC3.
f. Click Download then Play. The spectrum in Figure 6 will appear on all 4 DAC outputs (J17, J4, J5, and J7), Serial Line Rate will be 7.5Gbps. Figure 7 is a scope capture of the DAC output signal taken on three of the channels.
5. On SPIPro Quick Start Tab, click “Read All Registers” and confirm the GUI looks the same as Figure 4.
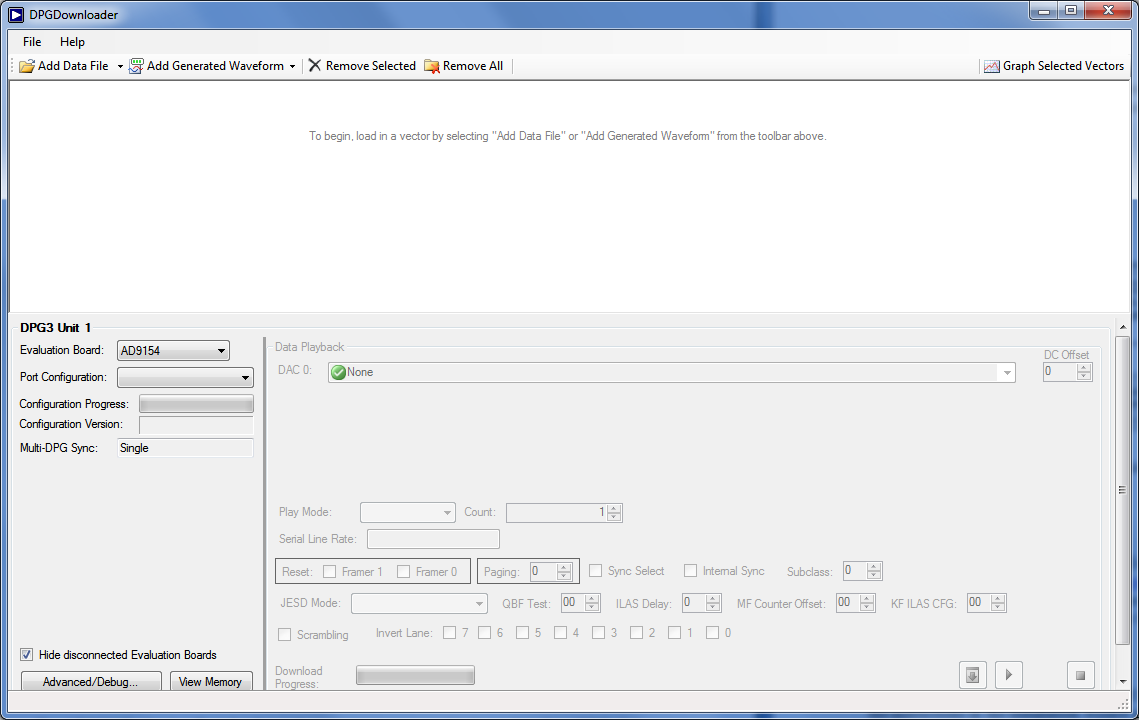
| Figure 4 DPG Downloader Panel at Start Up |

| Figure 5 Fully Configured DPG Downloader Panel |
6. Here is what you will see at the output of DAC0 on the Spectrum Analyzer.

| Figure 6. DAC Output Spectrum Analyzer Display |
7. Here’s what you will see on DAC1, DAC2, and DAC3 on the scope.

| Figure 7. DAC Outputs Scope Display |
resources/eval/dpg/ad9154-ace-ebz.txt · Last modified: 30 Nov 2015 21:29 by Larry Welch